Homepage / Precious Metals Charts: Palladium Price Charts
Palladium Price Charts
Palladium Price Charts (per troy ounce)
1) Palladium Spot Price - Candlestick Chart
2) Palladium Spot Price - Foreign Currency Charts
3) Palladium Spot Price - 20-year (High, Low, Close) Interactive Price Chart
4) Palladium (PALL - Palladium ETF) Technical Analysis - 3 Gauges (Summary, Oscillator, Moving Averages) Note: Palladium Technical Analysis is not available; however, PALL is, and it moves in unison with palladium's spot price.
Note: All the charts and gauges on this page are measurements of the market for each asset; they are in no way an endorsement of how you should invest or divest.
Palladium Spot Price
- Candlestick Chart -
Palladium Spot Price - Interactive Candlestick Chart.
On this chart, you can do your own Technical Analysis by selecting one of the buttons located above and on the left side of the chart.
If you wish to change the symbol, "Click" your Mouse over the Symbol Name "XPDUSD" and click the "÷" to find the symbol you want.
Choose "CFD" heading for a different commodity (ie: copper, oil, silver)
Charts provided courtesy of TradingView.com
ExpressGoldCash - 4.9 star - Customer Reviews
Return to the Top of the Page
Palladium Spot Price
Foreign Currency Charts
Return to the Top of the Page
![[Most Recent Quotes from www.kitco.com]](https://www.kitconet.com/charts/metals/palladium/t24_pd_en_broz_2.gif)
Free Shipping on Orders $199+ | 5.0 star Customer Reviews
Platinum 20-year
Spot Price Chart
(High, Low, Close)
Technical Analysis Gauges
Palladium Technical Analysis is not available, however, PALL is, and it moves in unison with palladium's spot price.
Note: All the charts and gauges on this page are measurements of the market for each asset; they are in no way an endorsement of how you should invest or divest.
Precious Metals Price Charts
Other pages you may like...
|
|
|
|
|
|
Free Shipping on Orders $199+ | 5.0 star Customer Reviews
Return to the Top of the Page
Palladium Price Chart
For Bullion Market News...
|
Support this Guide & Paypal Thank You for Your Support |
|
|
 | |||||
Free Bullion Investment Guide
Keep this Guide Online
& Paypal
Thank You for
Your Support
Search the Guide
| search engine by freefind | advanced |

Daily
Newsletter
Mintages
for
2024
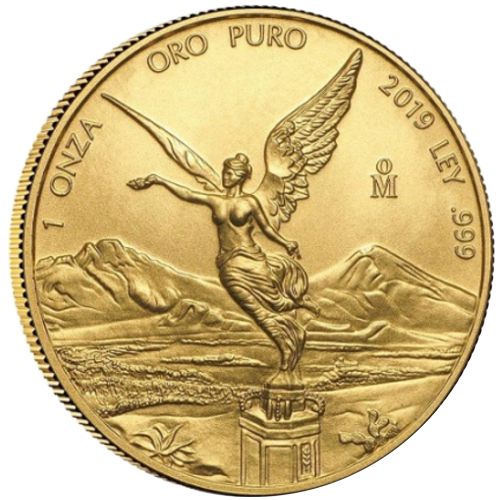
Gold & Silver Mexican Libertad
|
Gold Libertads |
Chinese Gold Coin Group Co.
& Chinese Bullion
2025
Gold & Silver Chinese Panda
|
Silver Panda |
Help Us Expand our Audience by forwarding our link
www.free-bullion-investment-guide.com.
Thank You!
March's

All Articles were Originally Posted on the Homepage

![[Most Recent Quotes from www.kitco.com]](https://www.kitconet.com/charts/metals/palladium/t24_pd_en_euoz_2.gif)
![[Most Recent Quotes from www.kitco.com]](https://www.kitconet.com/charts/metals/palladium/t24_pd_en_caoz_2.gif)
![[Most Recent Quotes from www.kitco.com]](https://www.kitconet.com/charts/metals/palladium/t24_pd_en_cnoz_2.gif)
![[Most Recent Quotes from www.kitco.com]](https://www.kitconet.com/charts/metals/palladium/t24_pd_en_auoz_2.gif)
![[Most Recent Quotes from www.kitco.com]](https://www.kitconet.com/charts/metals/palladium/t24_pd_en_bpoz_2.gif)
![[Most Recent Quotes from www.kitco.com]](https://www.kitconet.com/charts/metals/palladium/t24_pd_en_yeoz_2.gif)
![[Most Recent Quotes from www.kitco.com]](https://www.kitconet.com/charts/metals/palladium/t24_pd_en_sfoz_2.gif)
![[Most Recent Quotes from www.kitco.com]](https://www.kitconet.com/charts/metals/palladium/t24_pd_en_inoz_2.gif)
![[Most Recent Quotes from www.kitco.com]](https://www.kitconet.com/charts/metals/palladium/t24_pd_en_zaoz_2.gif)

