Homepage / Bullion Market Basics: Gold S&D 2010 - 2019
Updated 02/16/2024
Gold
Supply and Demand
2010 - 2019
Gold Facts
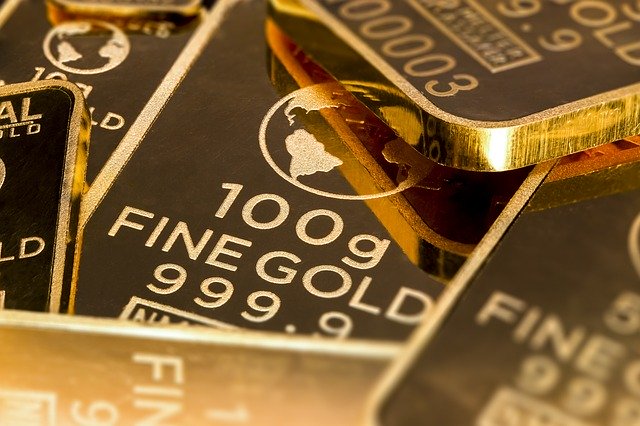
Gold is a chemical element with the symbol Au; the symbol comes from the Latin word "Aurum," which means "Gold."
Gold's atomic number is 79, which is the number of protons in a gold atom.
Gold is a dense, soft, bright yellow metal that maintains its color without oxidizing in air or water and is the most malleable and ductile metal known.
Gold has been a valuable and highly sought-after precious metal for coinage, jewelry, and other arts since long before the beginning of recorded history.
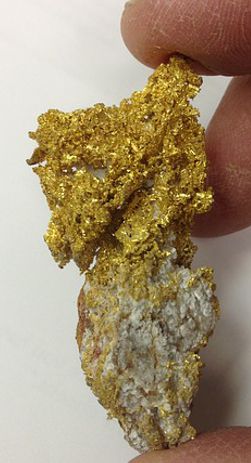
Gold occurs in free elemental (native state), as nuggets or grains, in rocks, veins, and alluvial deposits.
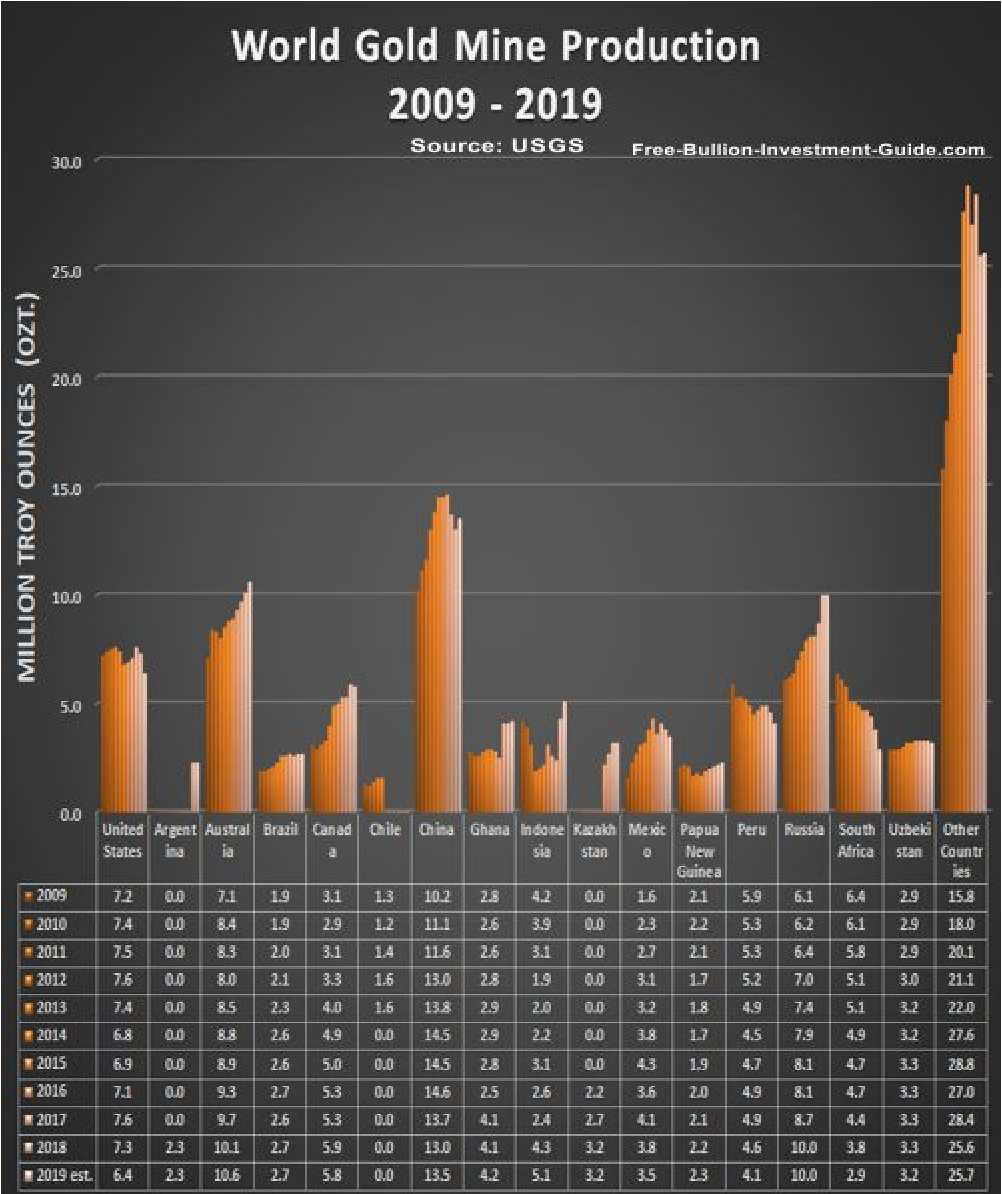
World Gold Mine Production
Gold Supply and Demand 2010 - 2019
ExpressGoldCash - 4.9 star - Customer Reviews
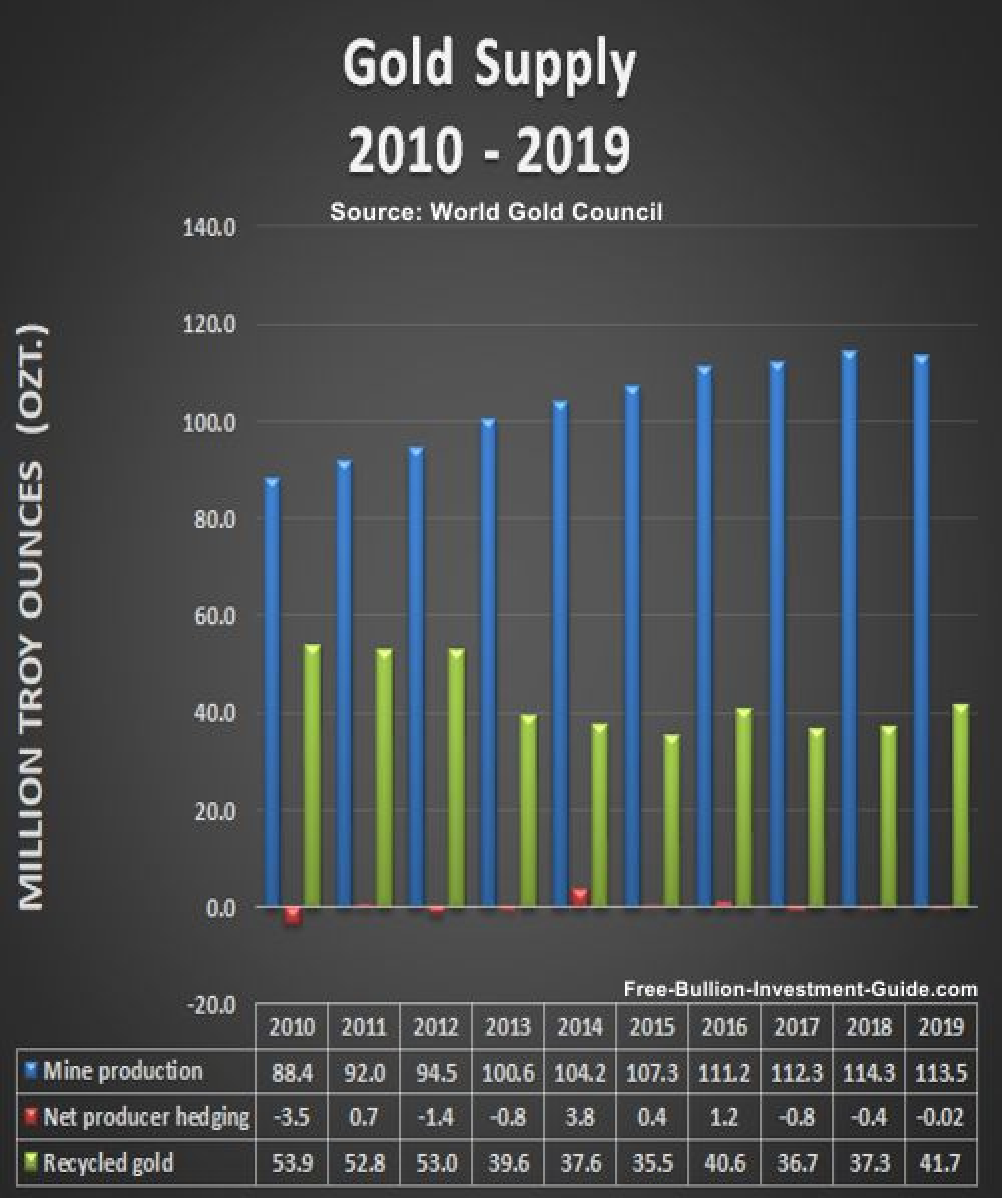
Gold Supply
Gold Mine Production
Gold mining is a global business that operates on all continents except Antarctica, extracting gold from diverse types and scales of mines.
Recycled Gold
Recycled or reclaimed gold is taken from existing jewelry, industrial metals, or electronics and refined to remove impurities, resulting in chemically identical material to newly mined gold.
Net Producer Hedging
Net Producer Hedging is the practice of mining firms selling gold ore ahead of time in anticipation of future output.
Hedging may also not appear on the supply side on a net basis, as it can form part of demand as de-hedging.
Over time, hedging activity does not generate a net increase in the supply of gold.
De-hedging has the opposite impact and will reduce the amount of gold available to the market in any given quarter.
Gold Supply and Demand 2010 - 2019
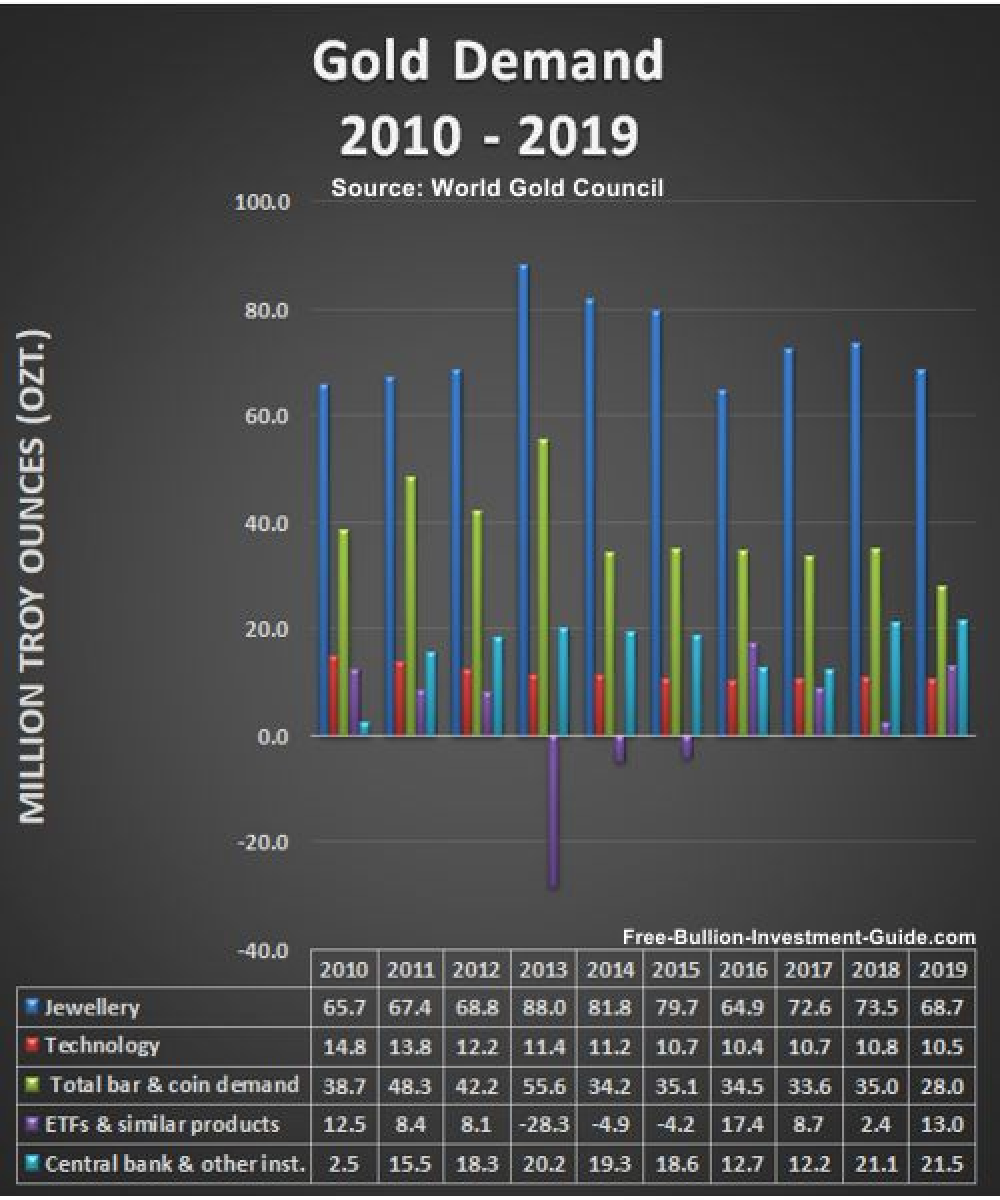
Gold Demand
Jewellery, Technology, and
Gold Bars & Coins
From 2010 to 2019, demand for gold jewellery remained consistent, while technology has gradually reduced its gold usage, and investment in gold bars and coins has also decreased.
ETFs and Central Banks
ETFs (Exchange Traded Funds) and investments like them are bought and sold on the major indexes; examples include GLD or IAU.
Like gold bars and coins, traders will buy and sell ETFs as a way to hedge market uncertainty.
One way to get a good idea of the broader market's mentality is to watch the inflows and outflows of these funds.
Central banks have generally been net buyers of gold over the 9-years.
Gold Supply and Demand 2010 - 2019
Sources: Gold Supply and Demand:
USGS.gov - Gold Statistics & Information
World Gold Council
Gold Price Charts (per troy ounce)
➤ Includes:
1) Gold Spot Price - Candlestick Interactive Chart
2) Gold Spot Price - Foreign Currency Charts
3) Gold Spot Price - 20-year (High, Low, Close) Interactive Price Chart
Other pages, on this guide, you may like...
|
|
|
|
|
|

Gold Supply and Demand 2010 - 2019
For Bullion Market News...
|
Support this Guide & Paypal Thank You for Your Support |
|
|
 | |||||
Free Bullion Investment Guide
Keep this Guide Online
& Paypal
Thank You for
Your Support
Search the Guide
| search engine by freefind | advanced |

Daily
Newsletter
Mintages
for
2024
Gold & Silver Mexican Libertad
|
Gold Libertads |
Chinese Gold Coin Group Co.
& Chinese Bullion
2025
Gold & Silver Chinese Panda
|
Silver Panda |
Help Us Expand our Audience by forwarding our link
www.free-bullion-investment-guide.com.
Thank You!
March's

All Articles were Originally Posted on the Homepage
