Homepage /Bullion Investment Ratios: Dow to Gold Ratio

ExpressGoldCash - 4.9 star - Customer Reviews
Originally posted 06/02/2013 Last Updated on 05/14/2025
Dow to Gold
Ratio
The Dow-Gold ratio is a market indicator that helps investors decide where to put their money and when to do it.

Investors regularly monitor the ratio because it accurately predicts the optimal times to invest in gold for safety or to take on more risk by investing in the stock market.
The two assets move in opposite directions; the ratio accurately judges when to stop chasing them when they're overbought.
How to Judge
the Dow to Gold Ratio
The Dow to Gold Ratio is calculated by dividing the Dow Jones Industrial Average by the price of one ounce of Gold.
|
|
÷ |
|
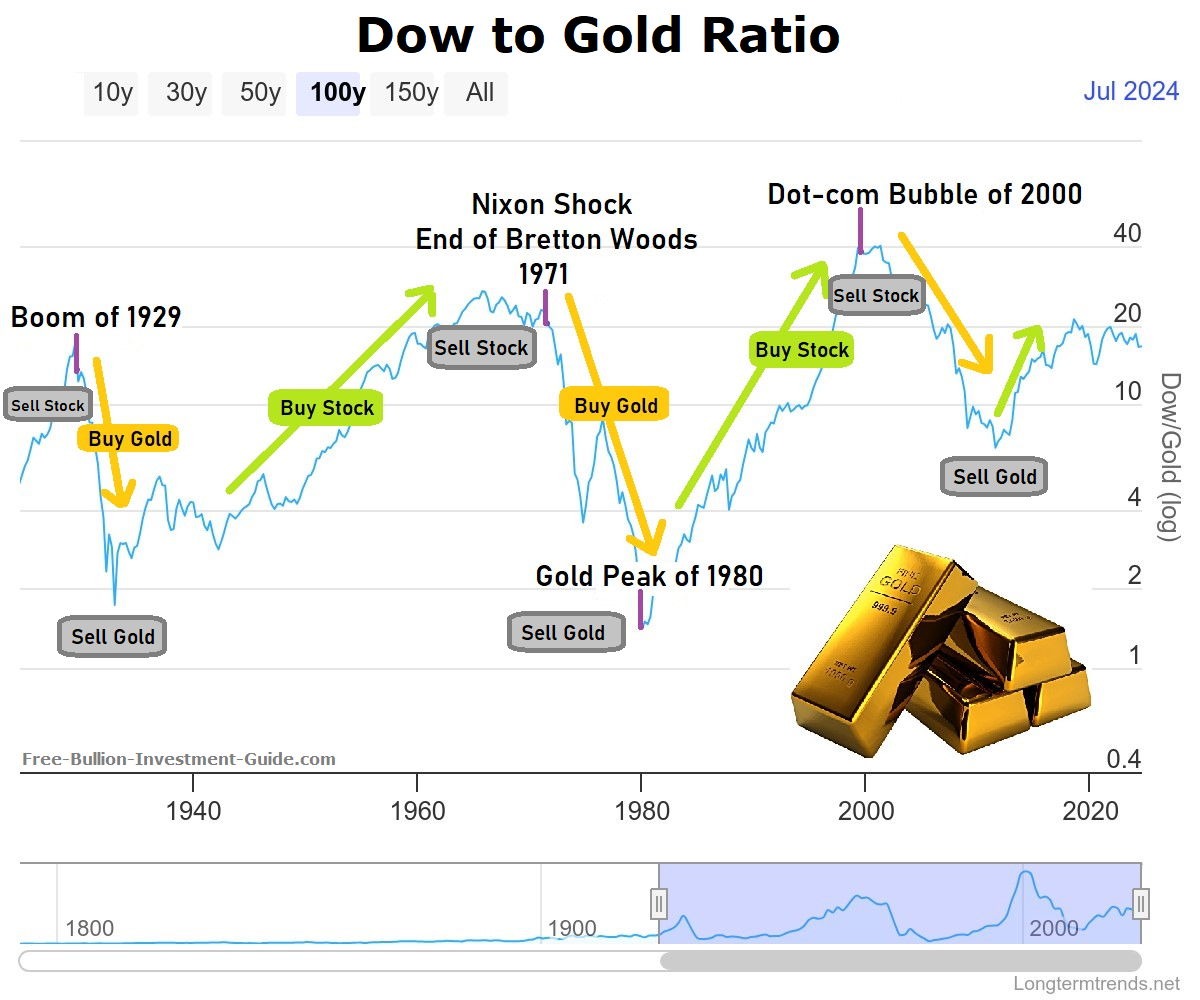
A high Dow to Gold ratio indicates the stock market's potential for a bubble. In contrast, a falling ratio indicates significant pessimism in the stock market, and the move to buy gold may have ended.
As shown in the chart below, as of July 2024, the Dow to Gold Ratio is slightly under 20, meaning it would take about 18 ounces of Gold to buy one share of the Dow Jones Industrial Average.
There are many strategies that investors have used to profit from the Dow-to-Gold ratio. This article, "Trading the Dow-Gold Ratio," is about one strategy that would have worked out well if you had a time machine, but it is still a good strategy for the future.
"Click" the following link for more information Longtermtrends.com
Dow Jones Industrial Average (DJIA)
The Dow Jones Industrial Average (DJIA) is a stock market index of 30 prominent companies listed on stock exchanges in the United States.
Since 1896, the DJIA has been the second oldest and most commonly followed industrial stock index. Tracking the Dow removes the guesswork and anxiety of trying to understand how the economy is moving in the United States.
How is the DJIA Calculated?
The DJIA is price-weighted, unlike stock indices, which use market capitalization.
The Dow Jones Industrial Average is calculated by adding the stock prices of the 30 companies listed on the DJIA and dividing the sum by the "Dow Divisor." As of July 22, 2024, the Dow Divisor was 0.15221633137872.
|
The Dow Divisor is updated every time a stock in the average splits or if a stock is taken out or added to the DJIA. BARRON'S publishes the Dow Divisor, found under the charts on this page: BARRON'S Market Lab. |
|
Gold
Charles Dow created the Dow Jones Industrial Average to give investors a broad indicator to help them understand how the industrial markets are moving.
Gold, like the Dow, serves as a broad indicator of how the markets are managing money.
Gold is a decentralized form of money; it's the only reserve asset of central banks with no governmental or corporate liability.
|
As with any physical asset, gold's only liability that helps or hurts its value is its demand among the masses which causes its fluctuation in price, but it will never be worth zero.
Gold acts as insurance that protects the value of your savings and investments when pessimism is high. |
|

4.7 star - Customer Reviews
Be Ahead of the Herd
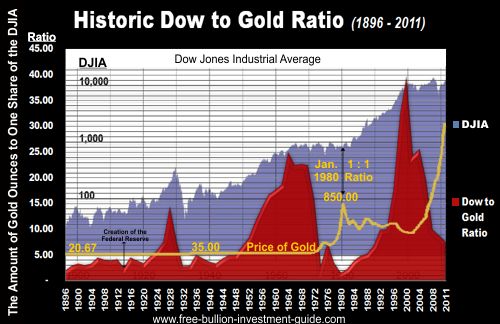
Since the Dow's inception in 1896, the markets have witnessed three
peaks and valleys in the Dow to Gold Ratio.
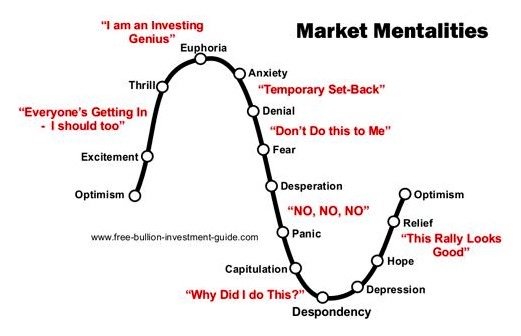
Each peak and valley has been an example of over-exuberance in the markets, only to be squashed by reality.
In every bull market, some investors have mentioned "The Good Times are Never Going to End," but eventually, they do.
Chasing parabolic markets is like trying to catch flames; you'll miss and get burned; it is virtually impossible to judge when the Dow-Gold ratio will peak or bottom.
The best way not to get burned is to do your homework, learn the markets, find sectors that you like, and focus on them. Keep in mind that the good days won't always last, and when they stop, it's good to have some gold as insurance for your portfolio.
The Dow to Gold Ratio is a good investment tool that can help you recognize when the markets are getting too good to be true for either asset.
"A philosopher once said that the most important knowledge is
knowledge of one’s own ignorance." - Thomas Sowell
History of the DJIA
In 1882, three investment writers, Charles Dow (pictured), Edward Jones, and Charles Bergstresser, created the Dow Jones & Company.
 Charles Dow
The business opened in Lower Manhattan, in the basement of a candy store, which is now the location of the New York Stock Exchange.
Dow Jones & Company's first publication was named the "Customer's Afternoon Letter," it was a daily journal for investors in which Charles Dow published the Dow Jones Averages, which contained nine railroads and two industrial companies.
On July 8, 1889, the Dow Jones & Company changed the name of the "Customer's Afternoon Letter" to "The Wall Street Journal."
The first stock average created by Charles Dow was the Dow Jones Transportation Average (DJTA); it held only nine railroad stocks and is the oldest stock index still in use.
In 1896, Charles Dow split the Dow Jones Transportation Average into two investment averages, the DJTA and the DJIA.
The Dow Jones Industrial Average (DJIA) is an index consisting of a broad range of public companies listed on stock exchanges in the United States.
The first Dow Jones Industrial Average consisted of 12 stocks; its initial value was 40.74. Currently, the average consists of 30 publicly listed companies, and as of late, the DJIA has consistently stayed above 35,000.

ExpressGoldCash - 4.9 star - Customer Reviews
Note: All the charts, commentary, and information on this page are in no way an incentive from this guide for how you should invest or divest.
Other pages, on this Guide, that you
may like...

ExpressGoldCash - 4.9 star - Customer Reviews
Dow to Gold Ratio
For Bullion Market News...
Notice:
The charts, commentary, and information on the Free-Bullion-Investment-Guide.com are in no way an endorsement of how you should invest or divest.
|
Support this Guide & Paypal Thank You for Your Support |
|
|
 | |||||

Ad Gloriam Dei
This website is best viewed on a desktop computer.
Keep this Guide Online
& Paypal
Thank You for
Your Support
with Feedly
Search the Guide
| search engine by freefind | advanced |
Premium Canadian Bullion

Give a lasting gift of the iconic Silver Maple Leaf bullion coin [More]
Free Shipping on Orders over $100 (CDN/USA)
or
From the U.K. Royal Mint

Daily
Newsletter
Updated Mintages for
American Gold Buffalo
American Gold Eagle
American Silver Eagle
2024 & 2025
Jerusalem of Gold Bullion
Coin photos
(bottom of page)
Mintages
for
2024
Gold & Silver Mexican Libertad
|
Gold Libertads |
Chinese Gold Coin Group Co.
& Chinese Bullion
Help Us Expand our Audience by forwarding our link
www.free-bullion-investment-guide.com.
Thank You!
Last Month's

In No Particular Order
December 2025
All Articles were Originally Posted on the Homepage
