Gold is Going Higher
Posted on 3/07/2024
by Steven Warrenfeltz
GOLD
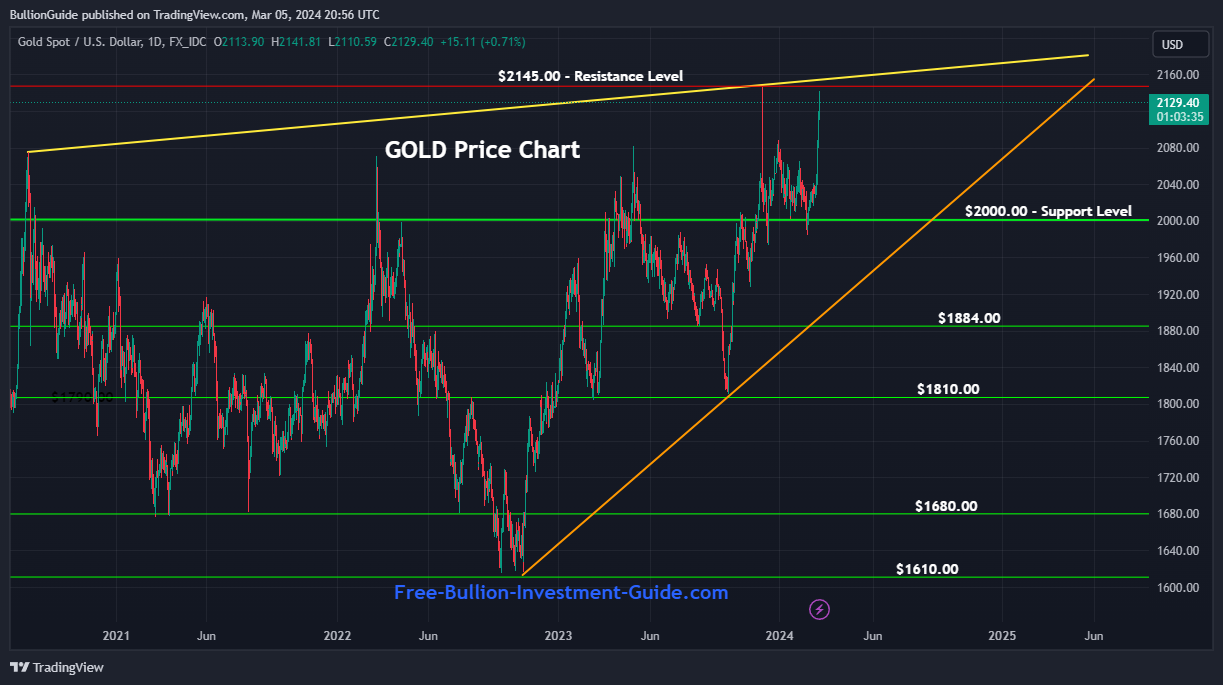
In this guide's newsletter released to subscribers two days ago, I wrote that I was watching gold's price as it moved inside a very large rising wedge, which is a negative sign for gold, unless gold's fundamentals continue to help it move higher.
The chart below was published in the newsletter released on March 5th.
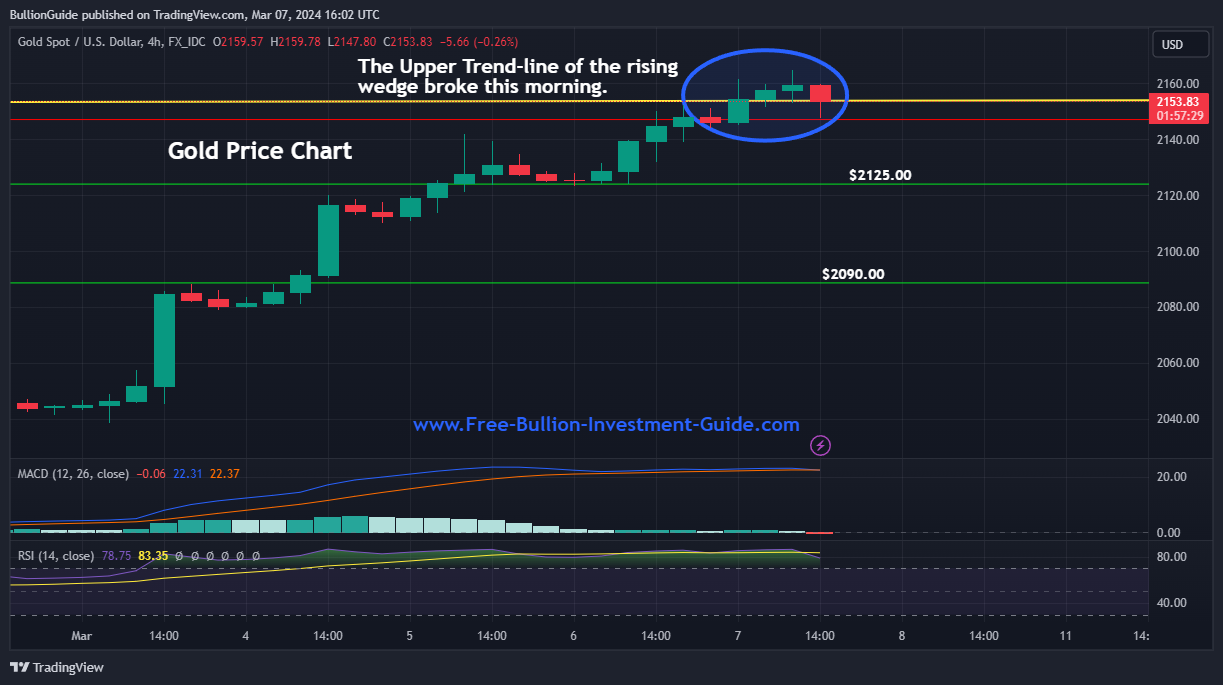
Whenever a negative pattern is broken to the upside, as gold did to this rising wedge, it is a very good sign that the price of gold will hold its recent gains and move higher.
Charts provided courtesy of TradingView.com
We will likely see some pullback in the price of gold; look for it to hold at one of its new support levels listed below.
From there, fundamentals in the market will move gold to new highs; look to tonight's State of the Union address and tomorrow's Non-Farm Payroll report for future movement.
Gold's Price Resistance Levels
$2265.00
$2200.00
$2185.00
Gold's Price Support Levels
$2145.00
$2125.00
$2090.00
$2000.00
Thank You for Your Time.
Take Care & God Bless,
Steve
'Click Here' see all of the prior Blog posts,
Other pages, on this Guide, that you
may like...
|
|
|
|
Investment/Information Disclaimer: All content provided by the Free-Bullion-Investment-Guide.com is for informational purposes only. The comments on this blog should not be construed in any manner whatsoever as recommendations to buy or sell any asset(s) or any other financial instrument at any time. The Free-Bullion-Investment-Guide.com is not liable for any losses, injuries, or damages from the display or use of this information. These terms and conditions of use are subject to change at anytime and without notice. |
For Bullion Market News...
|
Support this Guide & Paypal Thank You for Your Support |
|
|
 | |||||
Free Bullion Investment Guide
Keep this Guide Online
& Paypal
Thank You for
Your Support
Search the Guide
| search engine by freefind | advanced |

Daily
Newsletter
Mintages
for
2024
Gold & Silver Mexican Libertad
|
Gold Libertads |
Chinese Gold Coin Group Co.
& Chinese Bullion
2025
Gold & Silver Chinese Panda
|
Silver Panda |
Help Us Expand our Audience by forwarding our link
www.free-bullion-investment-guide.com.
Thank You!
March's

All Articles were Originally Posted on the Homepage
