Homepage / Archived News or Quarterly News / 2nd Quarter 2013
2nd Quarter - 2013
Charts, Bullion News & Commentary
When investing in any market, a good way to judge price movement in the future is to learn from the past.
This page provides a comprehensive overview of gold, silver, platinum, and palladium during the quarter.
For each of the precious metals, you'll find charts. Below the charts, you will find Bullion News Headlines from the 2nd Quarter of 2013. Every news link was originally posted on this guide's homepage.
The charts below are provided courtesy of
Gold Price Chart - 2nd qtr. 2013
Gold Price Chart (July. 1st, 2011 - June 30th, 2013)

Bullion News
Gold Price Summary
In the 2nd Quarter of 2013, Gold's spot price chart saw nothing but
new lows. Shortly after the 2nd Quarter began, Gold's price fell below
its support level, falling $200 below the $1520.00 level. Once Gold's price fell below this key support level, it became a key resistance level.
After two years of highs and lows, the price of gold may have finally hit bottom as it touches on a three-year low of $1179.40 at the conclusion of the quarter. Furthermore, the upper indicator (RSI) and the bottom indicator (MACD) are both bottoming out.
Gold Price Chart (Apr. 1st, 2013 - June 30th, 2013)

Gold Price Chart (July. 1st, 2012 - June 30th, 2013)

Bullion News

Silver Price Chart - 2nd qtr. 2013
Silver Price Chart (July. 1st, 2011 - June, 30th, 2013)

Bullion News
Silver Price Summary
Like Gold, Silver's price cascaded down, with limited buying after the start of the 2nd quarter of 2013. Silver's price fell through the strong support level of $26.00, turning it into a major resistance that will likely be hard for silver to break above.
The price of silver ended the quarter on a positive note by moving up more than $1.00 to $19.56 on positive volume. In addition, the top and bottom indicators indicated that silver's price was climbing out of its oversold region.
Silver Price Chart (Apr. 1st, 2013 - June 30th, 2013)

Bullion News
Silver Price Chart (July 1st, 2012 - June 30th, 2013)

Bullion News

4.7 star - Customer Reviews
Platinum Price Chart - 2nd qtr. 2013
Platinum Price Chart (July 1st, 2011 - June 30th, 2013)

Bullion News
Platinum Price Summary
Platinum broke its longtime support level in the 2nd qtr of 2013, turning it into a resistance level. Platinum's price has generally tracked sideways for the last two years until it broke below its support level.
However, at the very end of the
quarter, Platinum's upper indicator, RSI, and lower indicator, MACD, were showing signs that the precious metal was oversold and its
price should turn positive in the next quarter.
Platinum Price Chart (Apr. 1st, 2013 - June 30th, 2013)

Bullion News
Platinum Price Chart (July. 1st, 2012 - June 30th, 2013)

Bullion News

Palladium Price - 2nd qtr. 2013
Palladium Price Chart (June 1st, 2011 - June 30th, 2013)

Bullion News
Palladium Price Summary
Palladium's price fluctuated in the first part of the quarter before rising and almost surpassing its 2013 top of $788.45. However, shortly thereafter, it fell below 647.50 at the end of the quarter.
Palladium Price Chart (Apr 1st, 2013 - June 30th, 2013)

Palladium Price Chart (July 1st, 2012 - June 30th, 2013)

Bullion News
The charts above are provided courtesy of
2nd Quarter - 2013
Bullion News & Commentary
The Quarterly News starts with the end of the quarter articles, first.
Please be aware that not all of the links below are working; they have been retained because the headlines provide information on the state of the markets at the time.
06/30/13 - Bullion News
VIDEO (06:45) : MINING - Precious 'The washout is nearly complete': Jim Cramer
TECHNICAL ANALYSIS : CHARTS : Market Anthropology - The Case for Buying Precious Metals
CPI Financial - Precious Metals Report: Outlook for gold bleak?
The Telegraph - Gold price falls fuel 'record' bullion sales
Armstrong Economics - The Fed is so Short they need a High-Chair
AUDIO (39:50) : Peak Prosperity - Nick Barisheff: The Case for (Much) Higher Gold Prices
RT - Moscow exchange launches first precious metals trading
PrimeValues - France Officially Slips Into Recession
ANALYSIS : CHARTS : SolorCycles - Deflationary Demographics
06/29/13 - Bullion News
TECHNICAL ANALYSIS : CHARTS : Edge Trader Plus - Gold And Silver – Purely A Mental Game Right Now. Do Not Blink
CoinNews - Gold, Silver Fall in 2nd Quarter, US Bullion Coins Slow in June
PDF : TECHNICAL ANALYSIS : CHARTS : Wizzen Trading - Roadmap
ANALYSIS : CHARTS : Seeking Alpha - Chinese Physical Gold Demand Matches World Gold Production
INFO~GRAPHIC : ZeroHedge - Presenting Inflation...
Armstrong Economics - Why Banks ALWAYS Fail
Article & VIDEO (01:20) : MINING - Researchers make carbon wire that could replace copper
06/28/13 - Bullion News
Cato Institute - Don’t be Fooled: Uncle Sam Is Still Bankrupt
ANALYSIS : CHARTS : Gold Made Simple - A comparison between the 1970s 46% gold correction and today’s
Summary & VIDEO (05:57) : ZeroHedge - Even A Pawn Star Knows "Governments Can Screw Up The Currency"
Money and Markets - ‘Don’t Follow the Fed’ Will Be the Smart Money’s New Slogan
Wyatt Research - As Good as Gold, But Is Gold Still Good?
VIDEO (21:19) : Future Money Trends - Expert Analysis of Gold & Silver Drop and QE - Rick Rule Interview
Investment U - Are Gold & Silver Zombie Metals?
VIDEO (06:29) : Bloomberg - Gold Rebounding From 34-Month Low
TECHNICAL ANALYSIS : CHARTS : Prometheus Market Insights - Gold Correction Declines at Unsustainable Rate
CMI Gold & Silver - Krugman’s recipe for economic prosperity: Print more food stamps
Article & VIDEO(s) : CNBC - Gold Crashes Through Production Cost Levels
Business Insider - The Cost Of Mining An Ounce Of Gold (Barrick Gold's Stat Sheet)
VIDEO (12:28) : TECHNICAL ANALYSIS : CHARTS : The Technical Traders - Market Forecasts for the Precious Metals Market & more...
Online Business School - 10 Wealthiest Entrepreneurs of All Time
06/27/13 - Bullion News
ANALYSIS : CHART : MoneyBeat (WSJ) - ‘Gold Bears Beware’
Armstrong Economics - Gold in Currencies
VIDEO (05:19) : CNBC - Bull vs. Bear on Gold with Jim Rickards
ANALYSIS : CHARTS : McClellan Financial - Gold is Following in Stock Market’s 2009 Footsteps
Profit Confidential - Gold: Words of Wisdom from the Most Knowledgeable Gold Bug I Know
GoldMadeSimple - Disconnect between ‘paper’ gold and ‘physical’ gold markets continues as premiums DOUBLE in India
KATU (Oregon) - Collectible coins or a bag of lies?
PDF : Acting Man - In Gold We Trust - 2013
GoldSeek - A stock market addicted to stimulus
VIDEO (01:01) : Kanzius Foundation - President Nixon's War on Cancer
CoinWeek - Changes in the Silver Market, Part 1
GoldSilverWorlds - Silver – An Opportunity Reset by Ted Butler
MineWeb - New WGC gold cost guide should have investors dancing in the streets
VIDEO (02:36) : CNBC - Who's Going for Gold?
ANALYSIS : CHARTS : Got Gold Report - GLD Metal Holdings
Business Insider - It's The 30-Year Anniversary Of The Greatest Wall Street Movie Ever Made: "Trading Places" Here's The Story Behind It
06/26/13 - Bullion News
Edge Trader Plus - The Federal Reserve – A Study In Fraud
Silver Investing News - David Morgan on Drutter’s Divergence and the Silver Price
VIDEO (41:17) : McAlvany Weekly Commentary - Interview with James Rickards author of the national bestseller, Currency Wars
SafeHaven - Why I Own Gold
Deviant Investor - Going Dark! Economic Cycles Point Downward
VIDEO (04:39) : Bloomberg - Gold at $1,200 Around the Corner? / $2000 - 2016?
GoldSilverWorlds - Gold Tests Support At $1,200/oz
TECHNICAL ANALYSIS : CHARTS : Market Anthropology - Lightning Crashes
MineWeb - Sprott's John Embry, discusses the potential in gold stocks and manner in which gold is likely to move higher in the future
The Golden Truth - The Precious Metals Sector
GoldMadeSimple - Gold price ‘round-trips’ to flat for the day after huge drop in US GDP revision
Money and Markets - Place Your Bets on More Central-Bank Money-Printing
VIDEO (07:42) : CNBC - Marc Faber: Treasurys & Gold Are Very Oversold
Business Standard - India's Silver imports shoot up as prices drift to multi-year lows
TouitreNews - Vietnamese gold market - against all odds
ANALYSIS : CHARTS : ZeroHedge - Gold Drops Below Its Average Cash Cost
News10 (California) - Coin dealer thwarts thief's plan to steal small fortune
06/25/13 - Bullion News
CSInvesting - An Experienced Businessman, Money Manager and Investor Discusses His Views about Gold
Money and Markets - Gold’s Drop Begs the Question: When Is it Time to Buy?
Silver Coins Today - 2013 Great Basin ATB 5 Ounce Silver Bullion Coin Sales Begin Strong
TECHNICAL ANALYSIS : CHARTS : SafeHaven - The Gold COPS Have Arrived
Arabian Money - Why the Fed can’t possibly end QE and gold’s not dead
The Gold Report - After Labor Strikes, What's Next for Platinum?
INFO~GRAPHIC : SaxoMarkets - Currency Wars: Who is Winning the Race to the Bottom?
Numismaster - Gold Drop: An Opportunity?
TECHNICAL ANALYSIS : CHARTS : Sharps Pixley - Gold & Silver; Permabulls Era?
VIDEO (11:26) : ABC News (Australia) - Wall Street veteran Jim Rickards believes any problems the Reserve Bank has in trying to stave off a recession are its own fault
The Daily Mail - Negative interest rates could kill off savings returns, encourage cash hoarding and spell end of free banking... but Bank admits they're still an option
The Telegraph - Italy could need EU rescue within six months, warns Mediobanca
MINING - What’s an investor to do in markets like these?
Ludwig von Mises Institute - Who Says the Market Cannot Supply Its Own Money?
VIDEO (20:54) : Gordon T Long - Under The - Lens Bond Crisis
Free Shipping on Orders $199+ | 5.0 star Customer Reviews
Affiliate Ad
06/24/13 - Bullion News
Gold-Eagle - Gold And Silver - The Best Protection Against Modern Alchemy
MineWeb - Platinum prices to rebound on demand - CPM
The Prospector Site - PM FREEFALL: What should you do?
VIDEO (02:06) : CNBC - Cramer's Mad Dash: Allergan & Gold, Jim Cramer "I Buy Gold Coins"
Business 2 Community - Why Gold Bears Will Soon Find out They Are Wrong
VIDEO (07:10) : Charles Biderman - Biderman’s Daily Edge: Investors Bailing Since Taper Time Started, US Economy Nowhere Near Recovery
TF Metals Report - Losing Control
Dollar Collapse - The Nightmare Scenario
Money and Markets - Most Investors Are About to Learn This Lesson the Hard Way
MoneyBeat (WSJ) - Why the Markets Are Freaking Out
Business Insider - BUSTED: Bankers Caught On Tape, Joking About Bailout, And How They'd Never Pay It Back
AUDIO 60:26) : Peak Prosperity - Neil Howe: The Fourth Turning Has Arrived
The Gold Report - Ben Bernanke's Real Message for Gold Investors, Translated by John Williams
Money Morning - Why Silver Prices Are Down Today – and What's Next
ANALYSIS : CHARTS : SRSrocco Report - Step Aside India, China will Buy that Gold
GoldMoney - If the Fed has an exit plan then I’ve got a bridge in Brooklyn to sell you
GoldSeek - BIS warns banks dangerously exposed to $10tn bond market crash, so buy gold!
06/23/13 - Bullion News
ZeroHedge - The Bank Of International Settlements Warns The Monetary Kool-Aid Party Is Over
PDF : TECHNICAL ANALYSIS : CHARTS : Wizzen Trading - Things Just Got Ugly
MINING - China to overtake India in gold consumption thanks to 6.6 million bridal gifts
India Today - Spike in customs duty on gold import triggers innovative ways of smuggling with people risking their necks
06/22/13 - Bullion News
TECHNICAL ANALYSIS : CHARTS : Markets and Money - The Wrong and Right Way to Buy Gold, Part III
TECHNICAL ANALYSIS : CHARTS : Gold-Eagle - Gold Loses A Battle, But War Continues
VIDEO (09:01) & Transcript : SafeHaven - Marc Faber: Believing in Bernanke is Like Believing in Father Christmas
CoinNews - Gold, Silver Prices Plunge for Week; US Gold Bullion Coins Jump
TECHNICAL ANALYSIS : CHARTS : Edge Trader Plus - Gold And Silver – The End Is Near; Just Not In Sight
Numismaster - Platinum Eagles on Sale
The Prudent Bear - Latent Market Bubble Risks by Doug Noland
MINING - South Africa’s mining sector watchful: gold wage talks coming up
ANALYSIS : CHARTS : Casey Research (Ed Steer) - Gold’s 6% Fall Leads to Surge in Chinese and Asian Physical Demand Again
VIDEO (07:00) & Article : TF Metals Report - A Run on The Building & Loan
06/21/13 - Bullion News
CoinWeek - BITCOIN VS. GOVERNMENT-ISSUED FIAT MONEY
ZeroHedge - What Lies Ahead for Gold?
AUDIO : FSN - John Rubino – 2008 Is Back Again… Can You Spell Lehman Brothers
INFO~GRAPHIC : MINING - Is deep sea mining worth the risk?
Resource Investor - Bullion's day in sun is long gone as CME hikes gold margin
CHART : Visualizing Economics - Real Rolling Gold Returns compared to Stocks
Hard Assets Investor - Jim Rogers: I Bought More Gold Today; Bull Market Far From Over
Business Standard - India's top private banks are mulling an exit from the gold coins business
Business Wire - Findings Indicate Increase in Physical Gold Demand, Price Among Potential Effects of Fed Scaling Back Stimulus
ANALYSIS : CHARTS : Gold-Eagle - Will Rising rates Ruin The Recovery?
06/20/13 - Bullion News
Trader Dan's Market Views - Gold Cost of Production
VIDEO (02:56) : Bloomberg - USAA Investment Portfolio manager Dan Denbow discusses the gold meltdown
VIDEO (07:12) : Kitco News - James Grant Speaks on Gold & Silver's Latest Sell-Off
ANALYSIS : CHARTS : My Budget 360 - How the Fed is running out of economic curtains to hide behind when it comes to monetary policy
AUDIO (55:41) : Voice America - Hour 2: Jay Taylor Interviews Chris Martenson
MineWeb - Gold and Silver Fundamentals and a Much-Needed Dose of Reality Interview with David Morgan
MoneyBeat (WSJ) - Gold Déjà Vu, Sort Of
Market-Ticker - How Low Can It Go? by Karl Denninger
MineWeb - 122,000 jobs at risk in SA's platinum sector in 2015 - Nomura
Jesse's Café Américain - Pictures From a Monetization
Market Watch - The Fed is Wrong
ANALYSIS : CHARTS : The Washington Post - This graph shows how bad the Fed is at predicting the future
06/19/13 - Bullion News
ANALYSIS : CHARTS : Gold-Eagle - Silver And Gold Ratios
AUDIO : FSN - Bill Holter – The Debt To Gold Ratio Is Frightening
TECHNICAL ANALYSIS : CHARTS : Market Anthropology - "Silver"...Building Out a Foundation
GoldSilverWorlds - Own Physical Gold as Governments Destroy Wealth and Squander Tax Payers’ Money
VIDEO (08:35) : Kitco News - Tapering Could Be Good For Gold: Vince Lanci
GoldSeek - U.S. Mint Sales of Silver Coins Reach Record in 2013 First Half
ANALYSIS : CHARTS : Alhambra Partners - Sunday Gold Fix - The Gold Crash of 1975 - Evaluating the Gold Market of the 70's with Today's Gold Market
TECHNICAL ANALYSIS : CHARTS : Prometheus Market Insight - The Federal Reserve has Dug a Deep Hole
ANALYSIS : CHART : Profit Confidential - Why Investors Should Be Worried About the Sharp Rise in Bond Yields
Market-Ticker - Ben: My Ass Hurts by Karl Denninger
Wealth Daily - What Happens When Bernanke Quits? - 212% from the End of QE3
ANALYSIS : CHARTS : Advisor Perspectives - A Long-Term Look at Inflation
Daily Reckoning - “Out of Thin Air” by Ron Paul
Summary & AUDIO (16:47) : USA Watchdog - More than 100 Years of Money Printing Next Year - Wiedemer
Cato Institute - How Much Does Your State Government Depend on Federal Funds?
AUDIO (43:19) : McAlvany Weekly Commentary - This Week's Show: Emerging markets triggering next global recession, Trade surplus countries are inflation factories Gold charts firming, FED dictates short course
Edge Trader Plus - What Happens When You Continually "Kick the Can Down the Road"...Detroit: America’s Not So Bright Future
MineWeb - Silver: an important weapon against ‘superbugs’— Silver Institute
06/18/13 - Bullion News
CoinNews - Gold Hits 4-Week Low as US Inflation Subdued
VIDEO (01:56) : GoldSilver - Michael Maloney On Drutter's Divergence (Silver Demand)
VIDEO (01:18) : CNBC - Ron Paul's Thoughts on Gold
Seeking Alpha - The Gold Clock Goes TIC-Tock On SE Asia
UnCommon Wisdom - Gold’s Stretched-Out Rope
Econ Blog - Venezuela on the Brink of Hyperinflation
Numismaster - Bullion Premium, Delivery Near Normal
TECHNICAL ANALYSIS : CHARTS : Gold-Eagle - Pieces Of The Puzzle!
GoldSilverWorlds - Three Current Themes Precious Metals Investors Need to Consider
Money and Markets - The Truth About Inflation
Deviant Investor - All the Gold in Fort What’s-Its-Name
VIDEO (03:42) : CoinWeek - Gold Price and the Effect on the Coin Market
TECHNICAL ANALYSIS : CHART : Rick Ackerman - A Simple Look at Gold’s ‘Technicals’
Bloomberg - U.S. Mint Sales of Silver Coins Reach Record in First Half
TECHNICAL ANALYSIS : CHARTS : Sunshine Profits - Is Crude Oil Ready for a Breakout? What Impact Could it Have on Gold?
VIDEO (04:22) : Fox Business - Stockman: Fed Created a Bubble Machine
06/17/13 - Bullion News
TECHNICAL ANALYSIS : CHARTS : SafeHaven - Gold and Silver
VIDEO (05:32) : Charles Biderman - Bernanke Said Taper & Free Money Addicts Felt Withdrawal Symptoms
The Gold Report - Jay Taylor: In Precious Metals, Cash Flow Is King
VIDEO (25:14) : Ellis Martin Report - Interview with Silver Guru - David Morgan
GoldSeek - Chart of the Week: India Declares War on Gold
VIDEO (03:33) : Bloomberg - Is Silver Lost in the Gold Market?
Article & VIDEO(s) : CSInvesting - A Contrarian’s Dream (CEF); The Buffetts’ Thoughts on Money
Armstrong Economics - Why Government Should be Prohibited from Borrowing Money
INFO~GRAPHIC : MINING - Gold is from space
Daily Resource Hunter - Metals Prices Are Down? Tell That To These Guys…
MineWeb - Platinum market deficit to hit 844,000oz in 2013 - HSBC
ForexLive - Australia’s gold output down 5 pct in Q1
ZeroHedge - 222 Years Of Gold, Wars, Inflation, Economies, And Presidents
VIDEO (17:51) : USA Watchdog - Bail-ins-The Ultimate Win for Precious Metals-Eric Sprott
06/15/13 - Bullion News
ANALYSIS : CHARTS : McClellan Oscillator - Gold COT Data Show Bottoming Condition
TECHNICAL ANALYSIS : CHARTS : GoldSilverWorlds - Gold And Silver – Greater Certainty Is Found In Charts
CoinNews - Gold, Silver Advance on Week; US Silver Bullion Coins Stronger
TECHNICAL ANALYSIS : CHARTS : SafeHaven - Gold: Will it Drop to $500/ounce?
ANALYSIS : CHARTS : SRSrocco Report - Silver Price to Rise as Top Miner’s Production Evaporates
INFO~GRAPHIC : Canadian Coin - Canadian Junk Silver Coins - See if You Can Strike Silver
TECHNICAL ANALYSIS : Business Line - Platinum testing key short-term support
The New York Times - Suddenly, Retiree Nest Eggs Look More Fragile
TECHNICAL ANALYSIS : CHARTS : Sunshine Profits - Have Gold and Silver Stopped Responding to Dollar’s Price Action?
ANALYSIS : CHARTS : Jesse's Café Américain - Physical vs. Paper: The Shanghai Gold Exchange vs. the COMEX
Mish's Blog - Do You Trust Banks? Country by County Comparison
FirstPost - Jewellers’ fraternity disgraced after tax raid on RiddiSiddhi Bullions
INFO~GRAPHIC : ZeroHedge - Then And Now: What 100 Years Of Change Looks Like, In One Infographic
06/14/13 - Bullion News
AUDIO : FSN - David Morgan – Precious Metals Are Bottoming
Global Financial Inteligence - MEXICO? PREFER THE GOLD OR SILVER? (Google Translation Link)
Market Watch - Jim Rogers on bond bubbles, buying gold and the Japan disaster
Trader Dan's Market Views - Early Signs of Inflation?
VIDEO (02:16) : Bloomberg - Listen Closely: The Fed's Nowhere Near Tightening
247 Bull - If the Fed is going to begin taking away the punchbowl why is the dollar tanking?
ZeroHedge - Stunning Images From China: Ten Thousand People Waiting In Line To Buy Gold
Daily Mail - 'Stop buying gold!' Chidambaram begs gold-crazy Indians to ditch precious metal as imports send the rupee into decline
ANALYSIS : CHARTS : SafeHaven - Why is Gold Draining out of COMEX Warehouses?
Ludwig von Mises Institute - On This Day in 1933 (June 13, 1933)
The Big Picture - Succinct Summation of Week’s Events (June 14, 2013)
Kitco - Feature: Is It Sustainable To Mine Gold In This Current Price Environment?
MoneyWatch - Caterpillar to begin S. Milwaukee layoffs (Caterpillar Inc. (CAT) says it is placing about 260 production employees at its South Milwaukee plant on indefinite layoff because of weaker demand for mining equipment)
Pravda.ru - Why does USA need panic on gold market? (English Version)
GoldBroker - France : Public Deficits Getting Out Of Control
06/13/13 - Bullion News
Summary & VIDEO (06:27) : Got Gold Report - Frank Holmes - 'Non-Event if Gold Falls Another $100'
AUDIO (11:01) : Cato Institute - Robert A. Levy discusses capitalism, socialism, and the Constitution The Bob Harden Show
TECHNICAL ANALYSIS : CHARTS : Options Trading Signals - While the Fed Parties, Gold & Oil Have Left the Building
Casey Research - Are the Gold Bugs Wrong?
TECHNICAL ANALYSIS : CHARTS : Peak Prosperity - Is Gold at a Turning Point?
The Epoch Times - Behind China’s Golden Curtain
Article & VIDEO (02:49) : CoinNews - West Point Mint Houses $2.3 Billion in Gold Bars
Gold Made Simple - Director at the Bank of England admits: “We’ve INTENTIONALLY blown the biggest government bond bubble in history”
Dollar Collapse - "More than $2.5 trillion has been erased since Ben Bernanke said…"
VIDEO (04:04) : Bloomberg - Traders Said to Manipulate Currency Rates
Wealth Wire - Silver Coin Sales Could Set Record High
SLIDESHOW : Economic Times - Sneak peek: US Mint's gold & silver coins production facility
Bullion Street - Alaska still holds cards for Gold prospectors
Bloomberg - Metalor Set to Complete Singapore Gold Refinery by Year-End
06/12/13 - Bullion News
Financial Post - Investors shy away from gold, buy palladium
Summary & VIDEO (30:01) : GoldSilverWorlds - First Glimpse Inside Fed’s Gold Vault – National Geographic Documentary
The Hindu - Gold has a firm demand in a fluctuating market
Perth Mint Bullion - Monthly Sales - May 2013
TECHNICAL ANALYSIS : CHARTS : TheGoldandOilGuy - Tis the Season to Look At Gold & Oil Prices!
CHART : Armstrong Economics - Palladium – Not Gold?
CoinWeek - When Is A Dollar Not Worth A Dollar?
TECHNICAL ANALYSIS : CHARTS : Gold-Eagle - Golden Economics & Silver Surprise
AUDIO (45:33) : McAlvany Weekly Commentary - This Week: Volker & Greenspan join ranks of the concerned - Speculative gold shorts signal a bottom? - Mountain biking and investment principles
Investment Week - 'Disorderly bond yield jump' now biggest global risk
TECHNICAL ANALYSIS : CHARTS : Acting Man - Gold and Gold Stocks Update
ANALYSIS : CHARTS : Futures Magazine - Copper faces faux bullish fundamentals
CNBC - Big Dollars For a Silver Certificate
Business Insider - 10 Countries That Are Losing A Fortune On The Collapse In Gold
06/11/13 - Bullion News
CoinNews - Gold Ends Near Three-Week Low; US Silver Bullion Coins Rise
VIDEO (02:23) : Money Morning - How to Invest in Gold: Tips from an Expert (Sprott's Rick Rule ) on the Yellow Metal
VIDEO (02:58) : CNBC - Santelli: All Stimulus Fungible
GoldSeek - The connection between quantitative easing and the gold price
MINING - Grim BRICs news pushes copper to 5-week lows
AUDIO (03:44) : Korelin Economics - Rick Ackerman and Technicals
Bloomberg - Falling New Orders Signal U.S. Stock Inflation: Chart
Perth Mint Bullion - Suspended Silver Bullion Coins Back In Production
TECHNICAL ANALYSIS : CHARTS : Sunshine Profits - Bearish Picture for Gold from the Perspective of the Dollar and the Stock Market
Numismaster - Big Brother Knows You Have Gold?
The Guardian - Cash payments "In the UK" stage a comeback
ANALYSIS : CHARTS : CountingPips - The U.S. Dollar Under Pressure Again
Fed Watch - Bullard Holds His Ground

SD Bullion - 4.8 star Customer Reviews
06/10/13 - Bullion News
CoinNews - Precious Metals Rebound, Silver Eagle Bullion Coins Top 23M
The Prospector Site - BIBLICAL REASONS TO OWN GOLD & SILVER
ANALYSIS : CHARTS : ZeroHedge - Charles Gave Warns: "Should The Fed Lose Control, The Downside Move In Markets May Be Terrifying"
Gold Made Simple - Indian government threatens more action to manipulate gold demand lower
Article & VIDEO (99:27) : GoldSilverWorlds - Gold Price Reflecting Mike Maloney’s “First Deflation Then Inflation”
Deviant Investor - Silver Cycles: What Next?
Dollar Collapse - The Number That Matters
Rick Ackerman - Let Gold Do Its Job!
ANALYSIS : CHART : Market Anthropology - What Lies Beneath
The Telegraph - Deutsche Bank to open 200-tonne gold storage vault in Singapore
06/09/13 - Bullion News
PDF : TECHNICAL ANALYSIS : CHARTS : Wizzen Trading - Some More Downside Needed
Business Insider - MAULDIN: I'm So Sure Japan Is Screwed That I'm Converting My Mortgage Into Yen
The Telegraph - The fact is markets had gone up too far and too fast
Article & VIDEO (33:25) : SafeHaven - Gordon T Long; Unsound Money Inevitably Means a Corrupt Society with Special Co-Host John Rubino
Central Bank News - Monetary Policy Week in Review – Jun 3-7, 2013: 3 cut, 6 hold rates, markets adjust to withdrawal of global liquidity
AUDIO (19:36) : Peak Prosperity - Ron Paul: It's Going to Get Much, Much Worse - Why self-reliance & less government are key to our future
Seeking Alpha - What Really Happened To Silver: A Different Perspective
06/08/13 - Bullion News
CoinNews - Gold, Silver Drop for Week; US Bullion Coins Steady
Money and Markets - The Wrong and Right Way to Buy Gold
TECHNICAL ANALYSIS : CHARTS : Edge Trader Plus - Gold And Silver – Reality Does Not Matter. Potemkin COMEX Does
VIDEO (15:18) : KitcoNews - Roubini Doesn't Understand Gold - James Rickards
ANALYSIS : CHARTS : Market Ticker - Fed Z1: A SEVERE Storm Warning by Karl Denninger
The New York Times - Trying to Divine Intent of Fed, Wall St. Climbs
Money Observer - Did QE work?
Armstrong Economics - Wiemar Republic & Gresham’s Law
MINING - Pacific Ocean rich in gold, rare earths "Compared to on-land deposits they’re amongst the richest that we’ve seen"
06/07/13 - Bullion News
TECHNICAL ANALYSIS : CHARTS : CountingPips - Gold, Silver & Precious Metal Miners Signals By Chris Vermeulen
VIDEO (14:55) : TECHNICAL ANALYSIS : CHARTS : The Technical Traders - Stock market to bottom today/tomorrow. metals will be under pressure
VIDEO (03:55) : CNBC - Chart Shows Mysterious Gold Move
ANALYSIS : CHARTS : SRSrocco Report - Silver Investment Demand: The Ticking Time Bomb
Silver Coin Investor - Silver Prices: Paper, Physical and the Coin Dealer
TECHNICAL ANALYSIS : CHARTS : Zeal - Contrary Gold Futures 3 by Adam Hamilton
TECHNICAL ANALYSIS : CHARTS : Sunshine Profits - What Does the Lack of Gold’s Reaction to the USD’s Plunge Tell Us?
Bloomberg - Austrian Mint Expects Good Business on Gold in Coming Months
Wealth Daily - Silver Coin Investing
VIDEO (08:00) : TECHNICAL ANALYSIS : CHARTS : KitcoNews - Long-term Look at Gold Part 2 - "Chart This!" w/Gary Wagner
The Daily Business Post - France bans mail delivery of coins and precious metals
CoinWeek - Taxing Coin Sales: A Bureaucratic Nightmare In The Making?
POLL : Rasmussen Reports - 28% of Investors Say Their Finances Are Improving
GoldSilverWorlds - IMF Admits Lying About Greek Debt Crisis
AUDIO (13:35) : CATO Institute - Steve H. Hanke discusses the Money Supply on Bloomberg Surveillance w/ Tom Keene
Los Angeles Times - Greenspan says Federal Reserve should start tapering stimulus
Gains, Pains, Capital - Japan Just Gave Us a Warning of What’s Coming Our Way
ANALYSIS : CHARTS : Advisor Perspectives - The Fed Balance Sheet: What is Uncle Sam's Largest Asset?
VIDEO (25:45) : Max Keiser - Keiser Report: Osborne’s Schlub, Schnook, Yahoo & Yo-Yo
Money Morning - The Incredible World of Graphene
06/06/13 - Bullion News
CoinNews - Gold Ends at Three-Week High, Silver Gains 1.1%
AUDIO (32:00) : Ellis Martin Report - Ellis Martin Report with David Morgan--A Currency Showdown-East VS West
Seeking Alpha - U.S. And Canadian Mint Sales: All Of Domestic Silver Supply Used Solely For Bullion
UnCommon Wisdom - The Hidden Fed Meeting that Rocked the Markets
VIDEO (03:47) : YouTube - What is Fiat Money - Visual Explanation
Mish's Blog - Nouriel Roubini Seriously Misguided on Gold, on Equities, on Economic Growth, on Money
GoldSilverWorlds - Indian Government Desperately Tries To Discourage Gold Demand
Market Watch - When should you melt down gold?
AUDIO (53:46) : McAlvany Weekly Commentary - This weeks show: Gold in the ultimate form of cash, Gold is what you own when you’re not speculating, Change your mind about how you value everything
MoneyBeat (WSJ) - Easy-Money Addiction Could Hurt Performance
CNBC - Fed's Fisher: We Cannot Live in Fear of 'Monetary Cocaine'
Article & VIDEO (29:42) : Of Two Minds - Why Serial Asset Bubbles Are Now The New Normal
Investing - Gold gains as ECB hikes growth forecasts, U.S. jobs data support
Trader Dan's Market Views - Refer to Monday's Headline Post
ANALYSIS : CHART : The Real Asset Co. - COMEX revealed: Investigating the paper gold market
The Telegraph - Bank of England says no to more QE
MINING - CEO of London Metal Exchange quits
Casey Research - Don’t Dismiss the Possibility of Gold Confiscation
06/05/13 - Bullion News
Investing - Gold gains as U.S. jobs data falls short of market expectations
VIDEO (09:36) : TECHNICAL ANALYSIS : CHARTS : Kitco News - Long-term Look at Gold - "Chart This!" w/Gary Wagner
Investment Week - Why you should not write off gold...
TECHNICAL ANALYSIS : CHARTS : Gold Made Simple - Gold price back above $1400 and above the 20DMA – will it be 8th time lucky?
UnCommon Wisdom - Is It Time to Start Freaking Out About the Gold Supply?
ANALYSIS : CHARTS : ZeroHedge - The Debt Of Nations
SafeHaven - Precious Metals Leasing Explained
Perth Mint Bullion - A Question Of Purity
CNN Money - Are gold and silver close to bottoming?
TECHNICAL ANALYSIS : CHARTS : Market Anthropology - Still Golden
Daily Mail - Novice treasure hunter found £100,000 hoard of Roman coins 20 minutes into his first metal detecting venture
SilverSeek - David Morgan Interviews Nick Barisheff
Silver Coins Today - 2013 America the Beautiful 5 Ounce Silver Coin On-Sale Dates
ANALYSIS : CHARTS : Sprott Asset Mgmt - Redemptions in the GLD are, oddly enough, Bullish for Gold
06/04/13 - Bullion News
The Southwest Times - BBB warns of misleading free silver coin advertisement
AUDIO : FSN - Bill Murphy – Breaking News: Comex Admits Its Reports Are For Informational Purposes Only
Silver Lunar - 2014 Year of the Horse Coins (Lunar Series) from Perth Mint (Gold/Silver)
Seeking Alpha - Biggest Gold Mine In The World Shutdown: Is This The Catalyst Gold Has Been Awaiting?
TECHNICAL ANALYSIS : CHARTS : Sunshine Profits - Recent Moves in Gold and Silver - Temporary Strength or the End of Correction?
Peak Prosperity - Housing Prices Are Being Dangerously Distorted by Big Institutional Money
Barron's - Pimco’s Gross: QE Is ‘New Age Chemotherapy’ That Isn’t Working Well
The Big Picture - U.S. 10 Year Bond Yields in Perspective (1790-Present)
Deviant Investor - This Crazy Extend & Pretend Economic World
Merk Investments - Sell the Dollar? Case for Hard Currencies
VIDEO (03:10) CNBC - Santelli: Inflation is Baked in the Cake
Silver Coins Today - 2013 American Silver Eagle Bullion Coins Notch Strong May Sales
Bullion Street - Can Texas become 1st tax free Gold state?
06/03/13 - Bullion News
Money and Markets - GOLD: Four Secret Signals - How to Know When It’s Time to Buy or Sell - Interview transcript: Larry Edelson with John Browne
TECHNICAL ANALYSIS : CHARTS : Market Anthropology- Creative Seasonings
VIDEO (20:46) : TECHNICAL ANALYSIS : CHARTS : The Technical Traders - Analysis of the S&P, Precious Metals and other Markets
VIDEO (02:26) & Article : CNBC - Sprott's Rick Rule explains why he likes Physical Platinum and Palladium
Numismaster - New Bullion Law in Minnesota
INFO~GRAPHIC : The Royal Mint - The Changing Face of British Coins
MarketWatch - Silver shorts play a dangerous game, Commentary: The shorts could get caught here
MoneyBeat (WSJ) - What If Monetary Policy Doesn’t Work?
MineWeb - U.S. gold bullion coins headed for record despite sluggish May
Business Insider - One Of The Tightest Correlations To Gold Continues To Hold Strong
247 Bull - Speculators speculate about Gold's Future
ANALYSIS : CHART : TheGoldandOilGuy - Seven Keys in Timing Stock Market Tops – Part II
Seeking Alpha - Is It Time To Buy Platinum?
VIDEO (02:12) : PressTV - US dollar losing hold as world's currency
Trader Dan's Market Views - Gold ETF, GLD, Bleeding Inventory
Ludwig von Mises Institute - Japan's Easy Money Tsunami
06/02/13 - Bullion News
Investing - Gold/Silver/Copper futures - Weekly outlook: June 3 - 7
TECHNICAL ANALYSIS : CHARTS : SafeHaven - Gold and Silver - Recent Past and Near Future Possible Forcast
Seeking Alpha - The 3 Lessons Stock Investors Could Learn From Gold Investors
SRSrocco Report - Warren Buffett and the Investment Value of Gold
MoneyBeat (WSJ) - CFTC: Net Dollar Long Position Largest Since at Least 2007
Jesse's Café Américain - Financial Sector: Bigger and More Profitable Than Ever
GoldSilverWorlds - Gold Bear Or Bull? Mainstream Media Really Don’t Get It
VIDEO (07:08) : ZeroHedge - Peak Gold
Central Bank News - Monetary Policy Week in Review – May 27-31, 2013: 2 banks raise rates, 3 cut as focus shifts to end of U.S. QE
ANALYSIS : CHARTS : Gold Scents - REGRESSION TO THE MEAN
VIDEO (23:10) : MINING - Sprott's David Franklin: Platinum and palladium's year to shine
Coin Update - The Royal Mint Returns to the Tower in Style!
05/31/13 - Bullion News
247 Bull - The Big Picture: From banking crisis to sovereign debt crisis to currency crisis
Casey Research - Three Reasons the Case for Gold Remains Intact
Acting Man - A Novel Idea: Money Printing Creates ‘Wealth’
The Telegraph - No saviour in sight as world credit cycle rolls over
ZeroHedge - All Time Record Gold Transactions Reported By LBMA
The Epoch Times - Buyers Willing to Pay Premium for US Gold Coins
Fox Business (Stossel) - Keynes vs. Hayek - Econstories co-founders Russ Robert and John Papola discuss how the greatest economists of the past generation would deal with current economic problem VIDEO (06:52)
GoldSilverWorlds - High Premiums Reflect Strong Global Demand For Physical Gold
TECHNICAL ANALYSIS : CHARTS : Prometheus Market Insight - Gold Attempts to Form Intermediate-term Low
Gold Chat - Gold and silver market status update
Perth Mint Bullion - Asian Demand For Gold To Keep Rising - WGC
TECHNICAL ANALYSIS : CHARTS : Gold-Eagle - The Long Wait (nearly 21 months) is Almost Over
AUDIO (05:30) : Korelin Report - Rick Ackerman and Technicals
Profit Confidential - Japan Stock Bubble Built on Money Printing Bursts; And Our Turn Is
05/30/13 - Bullion News
VIDEO (12:16) : CNBC - Doug Kass Goes For Gold
Summary & VIDEO (05:12) : ZeroHedge - David Stockman: "The Error Of Central Banking Has Become Universal"
Wealth Daily - South Africa's Gold and Platinum Industry - Supply and Demand Struggle
Ludwig von Mises Institute - The Rise and Fall of the Dollar
ANALYSIS : CHARTS : GoldSilverWorlds - 5 Signs Of An Imminent Gold & Silver Price Rally
ANALYSIS : CHARTS : Acting Man - More Signs That a Giant Bubble is Underway
VIDEO (48:43) Gordon T Long - Macro Analytics - Mr. Global & GOLD w/ Catherine Austin Fitts & Ty
TECHNICAL ANALYSIS : CHARTS : Sharps Pixley - Gold & Silver; Physically Dependant!
WFMY News2 - The Not-So-Silver-Lining Of A (Dishonest) Silver Coin Newspaper Ad
ZeroHedge - Volcker On Bernanke's Grand Monetary Experiment: "Good Luck In That"
MoneyBeat (WSJ) - Gold Hits 8-Day High as Insecurity Grows
INFO~GRAPHIC : The Austrian Insider - The Bond Bubble Infographic: Visualizing Overvalued Treasuries
Gold Made Simple - Gold price trading back above $1400… but will it stick?
Bloomberg - Premiums on U.S. Mint Silver Coins Drop From 4-Year High
05/29/13 - Bullion News
CoinNews - Gold, Silver Advance; US Mint Bullion Coin Sales Surge
ANALYSIS : CHARTS : SRSRocco Report - Gold & Silver Maple Leaf Sales Increase in a Big Way
MoneyBeat (WSJ) - Take on the Economic Challenge. Play the Federator
Forbes - Somebody Is Messing With The Gold Market
CNBC - Is the Dollar Dying? Why US Currency Is in Danger
Profit Confidential - The Four Big Risks Massive Money Has Brought to the U.S. Economy
Trader Dan's Market Views - Month End Positioning Underway
Mish's Blog - Speculative Gold Bets at 5-Year Low; Metal Will Get “Crushed” Says Credit Suisse
ANALYSIS : CHARTS : GotGoldReport - Huge Rally Fuel in Place for Gold Futures
CoinNews - $5 Gold Eagle Sales Resume, Allocation Ends for 5 Oz Bullion Coins
VIDEO (08:14) : Cambridge House - David Morgan: "...we haven't found a bottom yet..." in gold & silver
ANALYSIS : CHARTS : My Budget 360- Why inflation matters: How the Fed is creating real estate inflation and hiding behind inflation data to continue their expansionary ways. OER and Case Shiller divergence
Wealth Daily - Inflation Fear - Real Interest Rates and Gold
AUDIO (39:56) : McAlvany Weekly Commentary - Retirees forced to be the new hot money gamblers - Bank of Japan losing control - Banking crises & currency crises are inseparable
The New York Times - Central Banks Act With a New Boldness to Revitalize Economies
Seeking Alpha - Gold Price And GLD Holdings Signal A Big Change Ahead
The Hindu - Reserve Bank of India not to ban sale of gold coins by banks
05/28/13 - Bullion News
AUDIO : FSN - Jeffrey Christian – Economy Will Be Much Worse Than Thought In 2013-2014
ANALYSIS : CHARTS : Market Anthropology - A Golden Opportunity
ZeroHedge - US Mint Resumes Selling One-Tenth Ounce Gold Coins... At A 40% Premium To Spot
Numismaster - The Other Run on Physical Gold
TECHNICAL ANALYSIS : CHARTS : Sunshine Profits - Can 1976 Give Us Insight Into Gold's Price Behavior?
Resource Clips - What's Next for Gold...Eric Coffin, Jay Taylor, Mickey Fulp, Mark Leibovit and Chris Berry discuss gold’s wayward ways
ToTheTick - Top Ten Most Expensive Cities and the Economics of Why!
VIDEO (48:45) : Grant Williams - Do the Math
TECHNICAL ANALYSIS : CHARTS : Sharps Pixley - Gold & Silver; Directionless
Kitco - Exclusive Interview: Gold's Volatility, Part of Its Tradition: Former Presidential Candidate Ron Paul
ANALYSIS : CHARTS : Gold Scents - STOCK BUBBLE: WAIT FOR IT TO POP
Deviant Investor - Back to Basics – Gold, Silver, and the Economy
PDF : 321gold - Gold is Different. What Next?
TECHNICAL ANALYSIS : CHARTS : TheGoldandOilGuy - Precious Metals & Miners Start Bottoming Process
VIDEO (07:12) : CNBC - Why Abenomics is Bonkers
05/26/13 - Bullion News
Seeking Alpha - Are There Any Gold Bulls Left In The U.S.?
AUDIO : FSN - Chuck Butler – The Dollar Is Going Down: Open Your Eyes
INFO~GRAPHIC : MINING - Explaining gold's big drop
ANALYSIS : CHARTS : Wall Street Pit - The Love Trade for Gold is Still On! by Frank Holmes
VIDEO (25:44) : Max Keiser - Keiser Report: Drowning In Central Banking Abyss
Trader Dan's Market Views - Speculators continue to Sell gold
TECHNICAL ANALYSIS : CHART : CEO.CA - The Most Important Level for Gold
TECHNICAL ANALYSIS : CHARTS : Investing - Silver: Bullish Divergence
05/25/13 - Bullion News
CoinNews - Gold, Silver Advance on Week; US Silver Coins Higher
TECHNICAL ANALYSIS : CHARTS : The TSI Trader - S&P 500 - 20 Year Study of Buy and Sell Signals
AUDIO (58:29) : Peak Prosperity - Chris Martenson Interviews Bill Black: Our System is So Flawed That Fraud is Mathematically Guaranteed
TECHNICAL ANALYSIS : CHARTS : Gold-Eagle - Dow Swoons And Gold Consolidates
VIDEO (06:02) : Sound Money Campaign - The Fiat End Game: Preparing For A Way Forward
Daily Reckoning - Bubbles for Bubbles’ Sake
TECHNICAL ANALYSIS : CHARTS : Edge Trader Plus - Gold And Silver – Markets Provide Us The Best Information
VIDEO (06:44) : GoldSilver - Bitcoin vs. Gold & Silver - Mike Maloney & Chris Martenson
AUDIO (18:19) : Silver-Investor - Interview with David Morgan; Something BIG Is Occurring in the Physical Market for Gold & Silver
Inflation Data - Highest Grossing Movies Adjusted for Inflation
05/24/13 - Bullion News
Analysis : Charts : McClellan Financial - Gold Coins Can Bring a Message
GoldSilverWorlds - Rick Rule – 10 Questions For Precious Metals Investors
Commentary : Technical Analysis : Charts Sunshine Profits - Timing the Final Bottom in Silver
CoinWeek - SILVER 101 – CHECK THOSE SILVER DOLLAR PREMIUMS
AUDIO : FSN - Chris Vermulen – Gold And Stocks Getting Ready To Trade Positions?
Business Insider - CITI: Gold Has Never Stayed Below The 'Stairway To Hell' For Very Long
London Evening Standard - Royal Mint is accused over £5 coin ‘that’s not worth a penny’ - Asked how the Royal Mint assesses their £5 value, Mr Lobel said: “They put the word £5 on it.”
SilverSeek - Busting the Perfect Crime by Ted Butler
TIME - Japan Market Crash: A Slow Leak in the “Central Bank Bubble”
Casey Research - The FOMC Minutes in Review
Financial Sense - Marc Faber: Central Banks Should Be Manipulating Gold Higher, Not Lower
GoldBroker - Bernanke’s Federal Reserve and other central banks will continue their superb productivity
AUDIO (58:29) : Peak Prosperity - Chris Martenson Interviews Bill Black: Our System is So Flawed That Fraud is Mathematically Guaranteed
05/23/13 - Bullion News
CoinNews - Gold Prices Rally, Silver Gains for Second Day
247 Bull - Examining the global crack-up boom: Part I
247 Bull - Examining the global crack-up boom: Part II
Arabian Money - Jim Sinclair predicts physical gold will soon replace paper gold to fix prices
Jesse's Café Américain - Gold Supply and Short Positions on the Comex: Option Expiration Next Week
Commentary : Technical Analysis : Charts : SafeHaven - Gold and Silver
VIDEO (03:14) : Yahoo Finance (BreakOut) - Gold Skeptics Have Peaked but Gold Prices Haven’t: Paul Schatz
Prometheus Market Insight - Looking Beyond Quantitative Easing
Deviant Investor - Scandals & Economic Disasters!
Commentary : Technical Analysis : Charts : Sunshine Profits - Gold Corrected on Weeks of Misconception
CoinWeek - Hong Kong Mercantile Exchange Defaults On Gold And Silver Paper Contracts
VIDEO (07:28) : GotGoldReport - Jim Grant – Fed Centric Markets Scary
MoneyNews - Central Bank Not 'That Close' to Winding Down Stimulus, Fed's Bullard Says
VIDEO (04:20) : FoxNews - What Will Happen When QE Ends?
CNBC - Kyle Bass Bets on Full-Blown Japan Crisis
Inside Investing Daily - Introducing the World's Best "Emergency Currency"
Commentary : Technical Analysis : Charts : Trading on the Mark - Every Trader and Investor Should be Watching the Dollar
GoldBroker - The New Great Wall of China : Gold
CoinNews - US Mint Sales: Proof Sets and Silver Coins Most Dominant
AUDIO 60:07) : McAlvany Weekly Commentary - Donald McAlvany: The Great Gold Robbery
Juggling Dynamite - Generation X: An inconvenient era by Danielle Parks
Market Ticker - Claims: +340k by Karl Denninger
Rolling Stone - The Mad Science of the National Debt
Financial Sense - Are Covert Operations Underway in the Global Currency Wars?
Chron - Texas could eliminate sales tax on silver and gold
Commentary : Analysis : Charts The Technical Traders - The Headline Data that Financial Media Ignored on Wednesday
VIDEO (04:18) : MoneyBeat (WSJ) - Looking Beyond Quantitative Easing
05/22/13 - Bullion News
CoinNews - Gold Dips as Other Metals Gain, US Silver Coins Rise
Bloomberg - Gold Is Still Relevant as Insurance Policy, Franklin’s Land Says
VIDEO (05:52) : KitcoNews - Gold Should Be Bought To Maintain Purchasing Power - Rick Rule
GoldSeek - China Platinum Imports Rise – Bullish Platinum and Palladium Fundamentals
AUDIO(s) : Turning Hard Times into Good - Jay Taylor Interviews Ted Butler for the First Time - Hour 1: Regaining Liberty through Gold and Silver. Defying J.P. Morgan and the Federal Government it Controls Hour 2: Regaining Liberty through Gold and Silver. Defying J.P. Morgan and the Federal Government it Controls
The Guardian - Fed chairman Ben Bernanke: stimulus programme not creating 'bubbles'
Market Ticker - Bernanke: I Love Bubbles by Karl Denninger
Mish's Blog - Bernanke's Semi-Annual Tap-Dance of Distortions, Half-truths, Lies, and Hypocrisy to U.S. Congress
GoldMoney - Fed exit strategy: the mother of all head fakes
VIDEO (12:22) : CNBC - Fed Chairman Bernanke Opening Statement
Rick Ackerman - Why Even Talk of Tightening Could Be Fatal
CNBC - How Gold Rallied for Years on a 'Misunderstanding'
MoneyNews - Jim Rogers: Yen's 'Collapse Very Dangerous'
ToTheTic - Hyperinflation – 10 Worst Cases
PrimeValues - How and What Bullion Dealers Sold Out this April and May
INFO~GRAPHIC : Visual Capitalist - What is the Cost of Mining Gold?
05/21/13 - Bullion News
CoinNews - Gold, Silver Retreat; US Mint Gold, Silver Bullion Coins Gain
VIDEO (23:37) : GoldSilver - Silver & Gold - The BIG Picture - Mike Maloney
Commentary : Technical Analysis : Charts : Sunshine Profits - Important Breakout in the Dow to Gold Ratio and Its Implications for Gold
Numismaster - Implications of Extreme Gold, Silver Price Volatility
AUDIO (21:41) : Ellis Martin - Ellis Martin Report with David Morgan-Gold and Silver Paper Shorting-Collusion
Merk Investments - Crash Proof Your Portfolio
Commentary : Analysis : Charts : Seeking Alpha - The Great Disconnect Between Paper And Physical Precious Metals Prices
Commentary : Technical Analysis : Charts : 321gold - Buy Gold On QE Exit News
Global Times - Latent demand expected to take tarnish off gold
UnCommon Wisdom - A Good Business to be (and Invest) in
CoinWeek - EBay sellers—One More Scam To Watch Out For
VIDEO (02:02) : CoinInfo - Coin Shop Armed Robbery by Man In UPS Uniform (Video of Robbery)
BullionVault - Gresham's Law
HedgeWeek - Lowest price in two years accelerates demand for physical gold
Peak Prosperity - Are the Predominant Macro Trends About to Reverse?
SilverSeek - Blockbuster in Gold by Ted Butler
VIDEO (02:25) : Bloomberg - Platinum and Palladium Shine as Gold Tumbles
MoneyWeb - Is the platinum sector imploding?
Commentary : Technical Analysis : Charts : Lido Isle Advisors - Platinum Pounced Today, Gold Back Down
Article & VIDEO (05:51) : CNBC - Copper and S&P Part Ways—Which Has It Wrong?
Free Shipping on Orders $199+ | 5.0 star Customer Reviews
Affiliate Ad
05/20/13 - Bullion News
CoinNews - Gold Snaps 7-Session Fall, Silver Gains, US Mint Coins Advance
Inside Investing Daily - Rick Rule; Why I am Still a Gold Bug
VIDEO (14:24) : MoneyNews - David McAlvany to Moneynews: Gold Poised to Surge
COMMENTARY : TECHNICAL ANALYSIS : CHART : SafeHaven - Is Gold's Bull Market Over? No
VIDEO (27:26) : USA Watchdog - Bank Run Happening in Bullion-Jim Willie
The Deviant Investor - Motive, Means, & Opportunity in the Gold Market
COMMENTARY : TECHNICAL ANALYSIS : CHART : Prometheus Market Insight- Gold Market Long-term Correction Continues
CoinInfo - Crime Alert: Coin Shop Break-In by Man In UPS Uniform
Market Watch - Gold, silver, and real estate will save you
COMMENTARY : TECHNICAL ANALYSIS : CHART : MPtrader - Is Gold Attempting to Put In a Secondary Low?
VIDEO (05:45) : Bloomberg - Gold Council Says 2013 Will Be Good Year in Tonnage
ZeroHedge - Bank Balances And Gold
05/19/13 - Bullion News
The Columbus Dispatch - As gold prices slide, two experts weigh in
AUDIO : FSN - Ned W. Schmidt – Should You Buy Google Or Gold
Dollar Collapse - Velocity of Money and the Crack-Up Boom
VIDEO (24:06) : TECHNICAL ANALYSIS : CHARTS : Gary Wagner - The Gold Forecast Testing, Testing After the Fall
ANALYSIS : CHART : The Southern - Sell in May and go away? Part 3
Article & VIDEO (08:22) : MoneyNews - Jim Rogers to Moneynews: Fed's 'Artificial' Inflation Will 'End Badly'
The Telegraph - BIS and IMF attacks on quantitative easing deeply misguided warn monetarists
MoneyWeb - Why is SA importing tons of gold from the US?
Summary & VIDEO (01:44) : ZeroHedge - Jeff Gundlach: "We Are Drowning In Central Banking"
Mauldin Economics - All Japan, All the Time
VIDEO (13:17) : TECHNICAL ANALYSIS : CHARTS : Inside Futures - GOLD Bearish Reversal in Progress, Could Hit 1300-Elliott Wave
05/18/13 - Bullion News
Trader Dan's Market Views - Bubble Views
Commodity Trade Mantra - Currency Wars: The Latest
COMMENTARY : TECHNICAL ANALYSIS : CHARTS : Edge Trader Plus - Gold and Silver – The True Story Is All About Time. Be Prepared
CHART : Jesse's Café Américain - Comparison of the 1976 Gold Bull Market and Today
VIDEO (02:32) : The Wall Street Journal - South Africa May Soon Be Producing Gold at a Loss
Wealth Wire - South Africa Imports $1 Billion of Unwrought Gold to Meet Global Demand
Gold Made Simple - Physical gold demand jumps 8% in a year according to the World Gold Council, whilst the price drops 5% – what gives?
UnCommon Wisdom - If You’re Selling Your Gold (or Thinking About it) …
Acting Man - It’s Official: Gold is Now the Most Hated Asset Class
Mish's Blog - Hollande Asks ECB to Engage in Japanese Style Currency Debasement
05/17/13 - Bullion News
COMMENTARY : TECHNICAL ANALYSIS : CHARTS : Sunshine Profits - Bullish Picture for the USD and Stocks and Its Implications for Gold and Silver
VIDEO (05:41) & Article : BNN - Gold on longest losing streak in 4 years...Palladium Shines
Sharps Pixley - Bearish Analysts’ Sentiments and Realized Gold Outflows Weigh Down Prices
VIDEO (14:53) : TECHNICAL ANALYSIS : CHARTS : The Technical Traders - Oil Trade Setup, Gold About To Bottom & SP500 Showing Weakness...
Gold-Eagle - When Central Banks Buy Stocks
COMMENTARY : TECHNICAL ANALYSIS : CHARTS : Market Anthropology - Follow the Leader
MSN Money - Why gold won't stay down
My Budget 360 - The facts behind the mountain of student debt: 13 percent of students owe more than $50,000 and nearly 4 percent owe more than $100,000. Student debt grew by 284 percent from 2004 to 2013
VIDEO (02:47) : The Daily Ticker - Jim Rogers on Gold: Continues to Have a Long Overdue Correction
BullionBullsCanada - The World Paper Council
COMMENTARY : TECHNICAL ANALYSIS : CHARTS : 321gold - Gold Needs RSI Breakout
INFO~GRAPHIC : The Austrian Insider - The Silver Squeeze
MINING - Gold worth $625,000 stolen from Miami airport
DREAMIN' : BuzzFeed - 30 Places You’d Rather Be Sitting Right Now
05/16/13 - Bullion News
CoinNews - Gold Off for Sixth Session as Inflation Falls, Gold Coins Jump
COMMENTARY : TECHNICAL ANALYSIS : CHARTS : Acting Man - Gold – An Update
VIDEO (13:58) : CNBC - Schiff: Gold a Generational Buy
Dollar Collapse - Golden Bullseye
Deviant Investor - Gold & What I Know for Certain
Wealth Wire - The Hunt Brothers; The Greatest Silver Story Ever Told
COMMENTARY : TECHNICAL ANALYSIS : CHARTS : Hubert Moolman - Silver Price Forecast: Silver and the Dow
COMMENTARY : TECHNICAL ANALYSIS : CHARTS : Gold Made Simple - Another look at the FTSE gold price ratio
Mish's Blog - Philly Fed Slips Into Contraction (Again); Current Conditions Recessionary, Future Expectations Far Too Optimistic
Article & VIDEO (10:38) : ZeroHedge - Bill Gross: "We See Bubbles Everywhere"
ZeroHedge - Gold Demand In One Chart: Physical vs ETF
Bullion Street - Central banks bought 109 tons of Gold during Q1-2013
PDF World Gold Council - Download Gold Demand Trends Q1 2013
ANALYSIS : CHARTS : Advisor Perspectives - What Inflation Means to You: Inside the Consumer Price Index
Seeking Alpha - The Future For Gold Supply Looks Grim: An Opportunity For Gold Investors
MoneyWatch - 15 homes that will help you survive a disaster
05/15/13 - Bullion News
CNBC - Central Banks Are Repeating Greenspan’s Mistake
COMMENTARY : TECHNICAL ANALYSIS : CHART : Gold~Prices - Gold Prices to Re-Test $1350/oz
Silver Coins Today - 2013 White Mountain ATB 5 Ounce Silver Bullion Coin Sales Begin
COMMENTARY : TECHNICAL ANALYSIS : CHART : Trader Dan's Market Views - Sell Stops Cascade Gold Down Below $1400
AUDIO (38:53) : McAlvany Weekly Commentary - About this week’s show: 3000 tons of “paper” gold sold in two days, Physical buying of real gold hits records, We’ve seen this before - Similarities to the 70’s
Dollar Collapse - Preparing For Deflation
Metal Miner - Global Metal Markets Seeing Prevalent Decline in Price Trends
CoinWeek - The Nickel-Hoarding Billionaire
RT - Yuan Dynasty: The ‘sexy’ Chinese growth story and China’s convertibility plan
Money Morning - The Next Move in the Currency War
The Washington Post - In global currency war, a new front opens in the South Pacific
MineWeb - Ron Paul: Pessimistic on Washington, positive on gold
Arabian Money - Are rising stock markets an early sign of a coming hyperinflation?
05/14/13 - Bullion News
CoinNews - Gold Falls, White Mountain 5 Oz Silver Bullion Coin Sales Start
247 Bull - This will end badly but not yet
Wyatt Research - Four Reasons I’m Buying Gold Today
ETF Daily News - The Best Has Yet To Come For Silver Investors
Wall St. Cheat Sheet - Can Silver Shine Brighter Than Gold?
COMMENTARY : TECHNICAL ANALYSIS : CHARTS : Sunshine Profits - Is Crude Oil Ready For A Breakout And Would It Help Gold?
CHART : Perth Mint Bullion - Monthly Sales - April 2013 A Record Month For Gold
Casey Research - Rick Rule: This Is Fun - Jeff Clark Interviews Sprott's Rick Rule
Bloomberg - U.S. Deficit to Fall to $642 Billion, Says Budget Agency
Forbes - What Gold Says About Interest Rates And Vice Versa
CFTC - CFTC Charges Global Precious Metals Trading Company and Michael Ghaemi of Coral Gables, Florida with Fraudulent Precious Metals Scheme
Sound Money Campaign - Fed’s Toolkit
LiveMint - Can’t stay invested? Lock in your money
COMMENTARY : TECHNICAL ANALYSIS : CHARTS : TheGoldandOilGuy - How to Spot & Time Stock Market Tops
Gains, Pains & Capital - It’s Official: Stocks Are In a Bubble
Inquirer Business - Small euro coins may be dropped—EU
MINING - Workers strike at Lonmin's South African Platinum Mine
05/13/13 - Bullion News
Investing - Dollar gains on firming U.S. retail sales, soft Chinese data
VIDEO (05:20) : FoxNews - What Caused the Decline in Gold Prices? - Rangold Resources CEO D. Mark Bristow on the outlook for gold prices
The Gold Report - Why Peter Grandich Is Still Telling His Wife Gold Will Hit $2,000/oz
UnCommon Wisdom - Why Should You Invest in Gold?
Global Research - The Central Banks’ Gold: A Story of Silent Expropriation
COMMENTARY : TECHNICAL ANALYSIS : CHARTS : Rambus Chartology - Impulsive Precious Metals..The Game Plan
VIDEO (01:52) & Article : Bloomberg - Gold Bears Pull $20.8 Billion as BlackRock Says Buy: Commodities
Edge Trader Plus - 11 Reasons For Abolishing The Fed
Deviant Investor - Silver Lows: A Discernible Pattern
COMMENTARY : TECHNICAL ANALYSIS : CHART : Trader Dan's Market Views - Quick Overview of Gold
Business Standard - The Reserve Bank of India (RBI) creates new gold import hurdle
ElliotWave - If the Fed Stops Easing, Will Gold Start Wheezing?
Consumerist - Trading That Old Quarter For An Ice Cream Cone May Not Be Such A Good Idea
Personal Liberty - Are Coins Better Than Bars?
05/12/13 - Bullion News
TECHNICAL ANALYSIS : CHARTS : Thoughts on Japan, the US Dollar and Gold
GoldSeek - The Hidden Crisis in the Gold Business
XinhuaNet - Gold rebound halted as fund outflows continue
Central Bank News - Monetary Policy Week in Review – 8 banks cut rates by 550 bps as BOJ easing ripples through world
The Southern - Eye on the Market: Sell in May and go away? — Part 1
The Southern - Sell in May and go away? — Part 2
05/11/13 - Bullion News
ANALYSIS : CHARTS : Options Trading Signals - Will Oil Futures Stop the Fed’s QE Program? (Good Read)
CHART : VIDEO (10:00) : ZeroHedge - Did "They" Ever Tell You To 'Buy Gold' Or 'Sell Stocks'?
TECHNICAL ANALYSIS : CHARTS : Edge Trader Plus - Gold And Silver – It Could Get Uglier And Take Longer
Daily Resource Hunter - The Return of The Worldwide Crack Up Boom
USA TODAY - G7 Says Japan Playing by Currency Rules
GoldSeek - The Golden Answer to Chinese Import Data by Eric Sprott
ANALYSIS : CHARTS : Gold-Eagle - Margin Debt And The Next Stock Market Crash
VIDEO (03:47) : Fox News - Big Margin Is Back
TECHNICAL ANALYSIS : CHARTS : SafeHaven - Why Buy Platinum, Palladium and Rare Earth Miners
Gulf News - Tourists pitch into UAE gold buying spree
Silver Coins Today - American Silver Eagle West Point Set Orders at 149,622 in 24 Hours
Mish's Blog - Read Between the Lines: IMF Admits Spain is Bankrupt; Get Your Money Out While You Can
05/10/13 - Bullion News
Investing - Gold nose dives as investors chase dollars ahead of G7 meet
TECHNICAL ANALYSIS : CHARTS : Sunshine Profits - Gold Stocks Are Leading Gold Lower
Perth Mint Bullion - Extremely Low Mintage Gold Bullion Coins
VIDEO (07:20) : CNBC - Does Fed Have Put on All Asset Classes?
The Golden Truth - "They" Are Throwing Jokes At Us Daily Now
MoneyMorning - Has the Great Gold Crash Divorced Bullion from Futures Prices?
VIDEO (05:25) : YouTube - What are Solar Panels Made From?
TECHNICAL ANALYSIS : CHARTS : 321gold - Gold Hurts But Dow Is Toppy
Dollar Collapse - Welcome to the Currency War, Part 9: What’s Wrong With These Pictures?
MoneyMorning - What You Absolutely Need to Know About Money (Part 7)
Rick Ackerman - Free Money for the Masses
Article & VIDEO (05:56) : MoneyNews - Steve Forbes to Moneynews: Fed's QE Comparable to the Titanic
TECHNICAL ANALYSIS : CHARTS : Acting Man - Gold and the Yen
The Telegraph - G7: US warns Japan to stick to rules on currency
WBNG (NewYork) - Counterfeit Coin Suspects Arrested
05/09/13 - Bullion News
Investing - Gold slides as U.S. jobless claims beat expectations
Dollar Collapse - One More Drop, Then Silver Back Above $25
TECHNICAL ANALYSIS : CHART : DailyFX - Almost Time to Sell Gold Again?
Wealth Management - Why Gold Is The Ultimate Alternative Currency
Money Morning - What You Absolutely Need to Know About Money (Part 6)
Reuters - U.S. Mint to limit purchases of 'America the Beautiful' silver coins
UnCommon Wisdom - The Real Value of Gold! (It’s not just an investment!)
Money Observer - How to invest in gold
VIDEO (06:06) : Bloomberg - BlackRock's Kapito, James Grant on Gold, Inflation
SilverSeek - The Worst Regulator Possible by Ted Butler
China Daily - Yuan reference rate hits high
PDF : Darryl Schoon - GOLD: WHO’S SELLING WHO’S BUYING WHO’S LYING
VIDEO (01:42) : Sound Money Campaign - Is A US Dollar Collapse Possible?
TECHNICAL ANALYSIS : CHARTS : Hubert Moolman - Silver Price Forecast: Silver Bull Market Is Following The Structure Of The 70s Bull Market
Bloomberg - Chinese Women Aren’t Taking Buffett’s Advice on Gold
Mish's Blog - Hugely Negative Real Interest Rates Fuel Yet Another Housing Bubble; A Word About "Inflation" and Treasury Yields
MineWeb - SA's gold wage talks sour before they begin
05/08/13 - Bullion News
CoinNews - Gold and Silver Rebound, US Mint Bullion Coins Gain
Silver Investing News - How to Avoid and Identify Fake Silver Products
AUDIO (31:10) : Mcalvany Weekly Commentary - The Great Divorce: Paper Gold vs Real Gold
Daily Reckoning - A Gold Number Literally Off the Charts
MorningStar - Jim Rogers' Gold Investment Philosophy - The maverick investor explains why he prefers to hold gold coins and his rationale for gold prices to continue to rise over the next decade
GoldMoney - Economic 'recovery' built on sand
VIDEO (09:16) : TECHNICAL ANALYSIS : CHARTS : The Technical Traders - Trading Analysis Video for Gold, SPX and Oil
Casey Research - Why There May Be a Lot Less Gold than We Realize by Chris Martenson
Central Bank News - Currency Wars: Global central bank rates tumble 350 bps in 24 hours
GoldSeek - Currency Wars: Winners and Losers
Investment U - The Best-Performing Precious Metal Just Got Even Better
AUDIO(s) : Turning Hard Times into Good - Where is our Gold? When Can We Have It? - Jay Taylor interviews David Gurwitz & GATA's Bill Murphy
UnCommon Wisdom - Before Gold Investors Got a Soft Spot for This Hard Asset...
ZeroHedge - Visualizing The Collapse Of Fiat Currencies
VIDEO (02:41) : The Daily Bail - Steve Forbes: Why Gold Collapsed
ANALYSIS : CHARTS : Gains, Pains & Capital - The Market is Now the Most OverBought In Four Years
05/07/13 - Bullion News
CoinNews - Gold Drops 1.3%, Silver Slips 0.6%
TECHNICAL ANALYSIS : CHARTS : Sunshine Profits - Further Declines in Gold
TECHNICAL ANALYSIS : CHARTS : Gold Made Simple - Gold price tests bottom of two week trading range as the 200 week moving average provides support again
Investing - Gold drops as German data sparks demand for U.S. equities
VIDEO (11:51) : Silver-Investor - Why Gold is Crashing, David Morgan
MarketWatch - The enduring glow of gold: Andy Xie - Despite ripple of skepticism, gold is the ultimate hedge on inflation
Silver Coins Today - 2013 Silver Eagle Bullion Coins Log Record April Sales
VIDEO (09:38) : CNBC - GoldCorp CEO: Gold is Still In a Bull Market
TECHNICAL ANALYSIS : CHARTS : 321gold - Gold $1400 or $1550?
GoldSilver - 223.5 Metric Tons of Gold Imported into China in March
ANALYSIS : CHARTS : My Budget 360 - Inflation in the most important things: Inflation hitting housing, tuition, and medical services. Is the Fed reinventing another debt based bubble?
TECHNICAL ANALYSIS : CHARTS : The TSI Trader - Gold and Silver: Sentiment Reversal is Inevitable
VIDEO (03:33) : Bloomberg - Steve Forbes: Bernanke Distorting Whole Market
TECHNICAL ANALYSIS : CHARTS : Prometheus Market Insight - Stock Market Secular Trend Review
MoneyBeat (WSJ) - NYSE Margin Debt Raises Eyebrows
05/06/13 - Bullion News
CoinNews - Gold Edges Higher, Silver Eagle Bullion Coins Top 19M
ANALYSIS : CHARTS : ZeroHedge - On The 3-Week Anniversary Of The Precious Metals Bear Raid
The Globe and Mail - Commodities: Be bullish, you're not buying at the peak
Market-Ticker - How Your Purchasing Power Was And Is Destroyed
TECHNICAL ANALYSIS : CHARTS : TheGoldandOilGuy - How to Trade Gold, Silver & Precious Metal Miners
Dollar Collapse - Welcome to the Currency War, Part 8: US Issues Variable-Rate Debt
Deviant Investor - The Incredible Weight of Quantitative Easing
Sound Money Campaign - Fed Stays on Course
Kitco - CME Group Increasing Margins For Comex Copper
VIDEO (01:43) : Bloomberg - Can Copper Fall to $2.94 a Pound?
TECHNICAL ANALYSIS : CHARTS : SafeHaven - Gold and Silver
Wyatt Research - Analyst Links Military Strategy to Gold Crash
Peak Prosperity - Marking the 4-Year Reflationary Rally: How Much Better Off Are We Really?
CoinNews - 2013 American Eagle Bullion Coins Skyrocket in April Sales
VIDEO (04:25) : Learn Liberty - What Is a Gold Standard?
05/05/13 - Bullion News
Fortune - Buffett worries about Fed's 'Huge Experiment'
VIDEO (02:10) : Bloomberg - Gold Remains the Best Store of Value in an Uncertain Global Economy, Elliott Management Corp
TownHall - Suspended, Halted, Out of Stock: The New Gold and Silver Supply Crisis
Rough & Polished - Does falling gold mean rising jewelry market?
Inside Futures - Gold: Too Pricey Yet? Or, Cheap Enough For Now?
Central Bank News - Monetary Policy Week in Review – May 4, 2013: Europe, India cut rates, Fed assures QE depends on economy
ANALYSIS : CHARTS : Street Talk Live - The Fallacy Of The Fed Model
Mauldin Economics - The QE Sandpile
VIDEO (01:06) : Perth Mint - How the Perth Mint Produces Minted Gold Bars
Affiliate Ad
05/04/13 - Bullion News
CoinNews - Gold, Silver Log Second Weekly Gain; US Bullion Coins Mixed
TECHNICAL ANALYSIS : CHARTS : Edge Trader Plus - Are You A Lion Or A Gazelle? You Had Better Know!
AUDIO (20:22) : Ellis Martin Report - Ellis Martin Report with David Morgan-Counterfeit Silver Eagles
Seeking Alpha - Sprott's Rick Rule On Bullion... 'There Is A Global Shortage'
TECHNICAL ANALYSIS : CHARTS : Gold-Eagle - Bull Flags
VIDEO (01:13) : TECHNICAL ANALYSIS : CHARTS : FXEmpire - Gold Prices May 6, 2013, Technical Analysis
MineWeb - Gold’s shift from weak to strong hands a good sign
AUDIO : FSN - Mickey Fulp’s Monthly Major Market Recap
PDF : The Royal Canadian Mint - "Breaking Tradition" 2012's Yearly Financial Report
TECHNICAL ANALYSIS : CHARTS : Trader Dan's Market Views - Fed Induced Stock Market Mania
The New York Times - Dow 15,000, and the Big Disconnect
PDF : Merk Investments - The Myth of the Rising Dollar
The Prudent Bear - Too Much Asset Inflation by Doug Noland
BullionBullsCanada - China’s Real Gold-Reserves At 4,000 Tonnes?
VIDEO (06:02) : BNN - The right way to buy bullion
05/03/13 - Bullion News
The Gold Report - James Dines Follows His Prediction of a Commodity Crash with Another One the Mainstream Media Is Ignoring
Perth Mint Bullion - 2013 Australian Kookaburra 1oz Silver Bullion Coin Sold Out
TECHNICAL ANALYSIS : CHARTS : Sunshine Profits - Will the Breakout in the USD Index Hurt Gold?
Money Morning - Gold’s in an Uptrend, but for How Long?
Kitco - Copper Rises 6% On Short Covering, Data, Inventory Draw, Central-Bank Comments
TECHNICAL ANALYSIS : CHARTS : UnCommon Wisdom - Are You a Gold Buyer or Seller?
Market Watch - What bullion dealers are saying about gold demand
CHART : ZeroHedge - Where The Jobs Were In April
AUDIO (17:33) : Silver-Investor - What's Next for the Metals, Miners, and Paper? - Interview with David Smith of the Morgan Report
AdvisorOne - One Major Reason to Include Real Assets in a Portfolio
VIDEO (15:04) : TECHNICAL ANALYSIS : CHARTS : The Technical Traders - Stock Market Juicy Details For Today and Next Week - GOLD, SPX, BONDS
MINING - Gold coins a safer, more valuable investment: CME Group
Numismaster - Legislation Seeks All-Steel Coinage
ANALYSIS : CHARTS : Financial Sense - Gentlemen, Start Your Printing Presses!
PrimeValues - Pick Gold Bottom for Investing
CoinNews - San Francisco Mint Coin Production Photos
VIDEO (02:56) : TECHNICAL ANALYSIS : CHARTS : The Disciplined Investor - Gold’s Recent Long Term Breakdown – Is the Dead Cat Bounce Over?
05/02/13 - Bullion News
CoinNews - Gold Gains 1.5% and Silver Advances 2.1% After ECB Cuts Rates
Investing - Gold shoots up as Draghi says negative interests are possible
VIDEO (02:52) : CNBC - Gold is likely to head sideways for most of 2013, but deflation could force prices higher, Jim Rickards of Tangent Capital says
Midas Letter - Mainstream Financial Press Continues Campaign of Gold Disinformation
CPI Financial - Platinum, palladium outlook 2013 from Thomson Reuters GFMS
VIDEO (27:05) : ANALYSIS : CHARTS : Gordon T Long - Macro Analytics - The Kondratieff Winter of Discontent - w/ John Rubino
Deviant Investor - What is YOUR Inflation Rate?
Casey Research - Bye-Bye, Bernanke… Hello Timmy?
VIDEO (13:23) : USA Watchdog - Fed Money Printing Games Out of Gas-Karl Denninger
Profit Confidential - Demand for Gold Bullion Coins Jumps Nine - Fold at U.S. Mint
05/01/13 - Bullion News
CoinNews - Gold, Silver Close Lower but Rise After Fed Holds QE Steady
Article & VIDEO (14:55) : CNBC - Fed Keeps Interest Rates Low, Continues Bond Buying Program
TECHNICAL ANALYSIS : CHARTS : Sunshine Profits - Gold Price in May 2013
TECHNICAL ANALYSIS : CHARTS : Gold Made Simple - The gold price ends up the month of April down 8% after being down more than 17% at one point
GoldSilverWorlds - Paper Money Has A Long History But Short Existence
Merk Investments - Rising Dollar Myth
FSN - Charles Hugh Smith – Debt Serfdom Is Alive And Well In The USA
CNBC - 'Real' Jobless Rate Still Above 10% In Most States
VIDEO (35:07) : ANALYSIS : CHARTS : Gordon T Long - Macro Analytics - What's Happening With GOLD? -w/ John Rubino
Daily Resource Hunter - The Real Reason You Should Care About Japan
VIDEO (15:02) : TECHNICAL ANALYSIS : CHARTS : The Technical Trader - Gold Traders and Investors Get Ready To Rumble!
Perth Mint Bullion - Perth – Australia’s Capital City Of Gold
04/30/13 - Bullion News
Investing - Gold jumps up on expectations for Fed to keep policy loose
VIDEO (16:11) : WhyGoldandSilver - Fake Silver Flooding Market - Mike Maloney & James Anderson
TECHNICAL ANALYSIS : CHARTS : Hubert Moolman - Silver Price Forecast 2013: Silver’s Bullish Cup Formation
Advisor Perspectives - Margin Debt Hitting Levels Only Seen ONE Other Time in History!
Perth Mint Bullion - 1oz Australian Kookaburra Mintage Declared At 500,000
Daily Resource Hunter - The Great Gold Train Robbery of 2013
TECHNICAL ANALYSIS : CHARTS : Peak Prosperity - Charting Gold
TECHNICAL ANALYSIS : CHARTS : Gold Scents - DOLLAR COLLAPSE HAS BEGUN
VIDEO (04:59) : CNBC - US Dollar Looks 'Weak'
Central Bank News - Currency Wars: Thailand to take action to curb rising baht
U.S. Global Investors - This Chart Answers a Classic Question about Gold
Deviant Investor - The Crash BEFORE the Climb
Summary & VIDEO (04:56) : Liberty Blitz Krieg - CME President on Gold: “They Don’t Want Certificates, They Want the Real Product”
Reuters - Dwindling U.S. gold stocks signal surge in physical demand
SilverSeek - What I’m saying on Facebook to get new people to consider silver...
TECHNICAL ANALYSIS : CHARTS : Gold-Eagle - Historic Volatility In The Gold Market? Not Yet!
Detlev Schlichter - Book review: David A. Stockman – “The Great Deformation – The Corruption of Capitalism in America”
ANALYSIS : CHARTS : My Budget 360 - Where have all the workers gone? The real truth behind the drop in the labor participation rate
VIDEO (05:59) : The Daily Ticker - Niall Ferguson to Paul Krugman: You’re Still Wrong About Government Spending
Live Mint - Perth Mint works through weekend as gold demand surges on price
Bullion Street - Moscow Exchange plans to speed up Gold market plan
04/29/13 - Bullion News
Investing - Gold soars as sentiment builds that Fed will keep monetary policy loose
CoinWeek - The Coin Analyst: 2013 Gold Libertads a Great Choice for Buyers
ANALYSIS : CHARTS : UnCommon Wisdom - A Tale of Two Metals
INFO~GRAPHIC : Gold Made Simple - Gold vs. Bitcoin
Seeking Alpha - Why Gold Will Protect You From Sovereign Debt Defaults
The Real Asset Co. - Mints running dry and Asia keeps stocking up
TECHNICAL ANALYSIS : CHARTS : SilverSeek - Precious Metals Chartology Roadmap
VIDEO (06:33) : Sound Money Campaign - Silver Rush...May 1st?
Kitco - Platinum Hits Two-Week High; Market Eyes Upcoming South African Wage Talks
Future Money Trends - Rhodium: The Fifth Element
AUDIO (16:55) : VOX - The Battle of Bretton Woods
ANALYSIS : CHARTS : Quartz - US pay growth is pathetic and expected to stay that way
247 Bull - Gold: A look at the fundamentals (supply & demand)
VIDEO (06:08) : Bloomberg - David Stockman, former Budget Director under President Reagan, and Josh Barro, Bloomberg View Columnist, discuss and debate U.S. monetary and fiscal policy
Acting Man - How to Make Austerity Work
Sovereign Man - Banking giant predicts gold price collapse
04/28/13 - Bullion News
Investing - Gold / Silver / Copper futures - Weekly outlook: April 29 - May 3
Seeking Alpha - Silver: Do Not Be Fooled - Lower Prices Ahead
Central Bank News - Monetary Policy Week in Review – Apr 27, 2013: One central bank cuts, pressure grows on Europe's politicians - "Last week nine central banks took policy decisions..."
Armstrong Economics - Hoarding Alternative Money & Reforming Banks
ANALYSIS : CHARTS : Acting Man - The Gold Futures Open Interest Caper
Seeking Alpha - Currencies, Precious Metals And A Dark Future: Sprott's Rick Rule Weighs In
Bloomberg - SILVER DEMAND : Re-Newables Investment Seen Tripling Amid Supply Glut
04/27/13 - Bullion News
ANALYSIS : CHARTS : Futures Magazine - Where is the larger bubble: S&P500 index or U.S. treasuries? - Can central banks outsmart history?
CEO.CA - The Most Bullish Gold CoT Report in Recent History
VIDEO (09:59) : ZeroHedge - "If" - Reflections On The Precious Metals
FX Empire - Silver Weekly Fundamental Analysis Date April 29 – May 3, 2013 Forecast
TECHNICAL ANALYSIS : CHARTS : Gold-Eagle - The Gold Dust Settles
South China Morning Post - Sharp price fall triggers surge in China gold imports
MINING - Scramble for silver coins driven by bargain hunting, not fear
TECHNICAL ANALYSIS : CHART : West Kentucky Star - Eye On The Market: Silver - Why The Selling?
Bullion Street - No reason for US Mint to stop selling Gold coins to American investors: Gold Coin
AUDIO (41:35) : Peak Prosperity - Robert Mish: Front-Line Observations from a Seasoned Gold & Silver Bullion Dealer
PDF : U.S. Global Investors - How a Landslide Shifts Copper Supply
MunKnee - Only Here! Authorized Excerpts from Nick Barisheff’s New Book “$10,000 Gold”
TECHNICAL ANALYSIS : CHARTS : Prometheus Market Insight - Gold Market Oversold Reaction Continues
Dollar Collapse - First-Quarter GDP: Way Worse Than It Looks
The Motley Fool - Trending Now: A New Gold Rush?
VIDEO (04:42) : The Daily Ticker - The Bull Case for Gold Hasn’t Changed One Iota: Michael Pento
04/26/13 - Bullion News
Investing - Dollar dips as U.S. GDP growth rate disappoints
TECHNICAL ANALYSIS : CHARTS : Sunshine Profits - Silver's Underperformance Against Gold
Forbes - Perth Mint: 'Our Business Has Doubled'
Midas Letter - Why Gold Is The Ultimate Alternative Currency
Kitco - WGC's Artigas: Gold Remains 'Under-Owned' Asset In Portfolios
Daily Reckoning - Gold Demand: The Great Disconnect Between Paper and Bullion
TECHNICAL ANALYSIS : CHARTS : 4-traders - SILVER : Beware of perturbations
AUDIO (31:13) : Peak Prosperity - The Spot Price of Precious Metals Is Becoming Irrelevant
Ahead of the Herd - Chains of Fiscal Discipline
Xinhua Net - Gold's long-term investment value retained: WGC
VIDEO (03:09) : Bloomberg - Investors Want Physical Gold: Nessim
04/25/13 - Bullion News
Investing - Gold gains after U.S. jobs data fuels demand for risk
TECHNICAL ANALYSIS : CHART : Hubert Moolman - Gold Forecast 2013: On the Verge of a New Monetary Order and Gold’s Rise
Rick Ackerman - No Time for Gold Bulls to Throw in the Towel
ANALYSIS : CHARTS : Gains, Pains, Capital - The One Trendline To Watch For Gold
Ludwig von Mises Institute - Come Back to Gold
TECHNICAL ANALYSIS : CHART : Gold Made Simple - Gold price breaks above the 200 week moving average – now 10% higher than last tuesday’s lows
CNBC - More Money Printing? Here's How It Could Happen
The Golden Truth - Is Your Gold Missing?
Deviant Investor - COT Data and Silver
Market Watch - Gold futures logs biggest one-day gain of the year
Money Morning - Jim Rogers Exclusive: Once Gold Bottoms, We’re Looking at ‘A Multi-Year Bull Market’
Rolling Stone - Everything Is Rigged: The Biggest Price-Fixing Scandal Ever
Daily Resource Hunter - The Dust Settles, A Deal Emerges (In Gold!)
Dr. Housing Bubble - The return of the prodigal interest only loan: The appearance of safety is bringing back our favorite mortgages
Bloomberg - Texas University Fund Sold $375 Million in Gold Bars
GoldSilverWorlds - The Misguided Case for Capital Controls
Wealth Daily - Silver Investing 2013 - Growing Supply and Demand
TECHNICAL ANALYSIS : CHARTS : Prometheus Market Insight - Risk of Violent Stock Market Correction Remains High

Affiliate Ad
04/24/13 - Bullion News
Investing - Gold gains on growing talk of ECB rate cut, soft German data
VIDEO (06:34) : The Daily Ticker - Use Silver as Currency: David Morgan
ANALYSIS : CHART : Mish's Blog - U.S. Mint Runs Out of Smallest American Eagle Gold Coin; Is There a Shortage of Physical Gold? Coordinated Smackdown by Naked Shorts?
TECHNICAL ANALYSIS : CHARTS : Gold-Eagle - Gold Price Is Stabilizing
Money Morning - Jim Rogers Exclusive: It's a "Race to Insanity"
The Washington Times - China gains another step to replace U.S. dollar with yuan in global markets
TECHNICAL ANALYSIS : CHART : 247 Bull - How to profit from higher platinum prices
Bullion Street - Unusual surge in Russia's Palladium shipments to Switzerland: Barclays
The Silver Institute - Continued Strong Silver Investment Demand Drove Annual Average Price to Second Highest on Record
Perth Mint Bullion - Silver Coin Production Focussed On Three Key Products During Demand Surge
Seeking Alpha - Worldwide Silver Shortage As Premiums On Silver Eagles Reach 40%
Money Morning - Here’s Proof the Silver Bullion Market is Alive and Well
VIDEO (18:45) : TECHNICAL ANALYSIS : CHARTS : Gary Wagner - Gold & Silver Technical Forecast
MoneyNews - Paulson Says He's Staying the Course on Gold
eKantipur (Nepal) - Bullion traders defy govt inspection
The Washington Post - Turkey’s traditional gold trade comes under pressure
CoinWeek - Numismatic Consumer Alliance Recoveries Top $7 Million For Purchasers of Overpriced Coins
Business Insider - Here's How Many Tons Of Rock You Have To Mine Just For An Ounce Of Gold
04/23/13 - Bullion News
Investing - Gold falls on weak global factory gauges, U.S. home sales
The Golden Truth - Unintended Consequences - U.S. Mint Temporarily Suspends Sales of One Tenth Oz. American Eagle Gold Bullion Coins, Citing Strong Demand
Numismaster - Don't Fall for Gold Scams
CNBC - Gold Is Undervalued in Fiat Money Terms
My Budget 360 - Reinventing GDP: US GDP to be revised in July by adding “intangibles” to the tune of $500 billion. The make believe economy.
VIDEO (09:06) : USA Watchdog - These are Perilous Times - Jim Rogers
Deviant Investor - Falling into a Golden Twilight Zone
Market Watch - Goldman: It's time to close out those gold shorts
BoomBustBlog - As Forewarned, The Irish Savers Have Just Been "Cyprus'd", And There's MUCH MORE "Cyprusing" To Come by Reggie Middleton
ANALYSIS : CHARTS : Gold Made Simple - Gold price being kept in check by the 200 week moving average as Arizona looks set to legalise gold
Wealth Wire - 10 Signs the Paper Gold Crash Has Unleashed a Global Run on Physical Gold and Silver
Casey Research - Physical Gold vs. Paper Gold: The Ultimate Disconnect
VIDEO (12:31) : Bloomberg - Ron Paul on Gold: No One Knows Value; I'm Buying
International Man - An Avalanche of New Regulations You Need to Know About
04/22/13 - Bullion News
ANALYSIS : CHARTS : U.S. Global Investors - Gold Buyers Get Physical As Coin and Jewelry Sales Surge by Frank Holmes
AUDIO (23:49) : Elliot Wave - Q&A: Robert Prechter on the Fed, Inflation, Gold and More
SafeHaven - Is Gold a Disappointing 'Safe Haven'?
ANALYSIS : CHARTS : Gold Made Simple - Gold price now 8% higher than the lows last week as the Swiss prepare for a referendum banning central bank gold sales
Market Watch - Gold gains for third session, reclaims $1,400
Money Morning - These Commodities Traders are Hoarding Copper for the Ultimate Profit Play
VIDEO (01:40) : Bloomberg - Gold Market: Who's Buying, Selling and Holding?
VIDEO (02:49) : CNBC - Santelli: Are We Rewriting Economic History?
04/21/13 - Bullion News
CPI Financial - Precious Metals Report: Reasons to be cheerful...
VIDEO (06:20) & Article : BNN - Gold slide flashes warning signs for global economy
MoneyWeek - MoneyWeek roundup: Why we're hanging on to our gold
South China Morning Post - Mainland Chinese shoppers invest billions in gold
MINING - Swiss to vote on whether their central bank can sell gold reserves
04/20/13 - Bullion News
CoinNews - Gold, Silver Plunge on Week; US Gold Bullion Coins on Fire
TECHNICAL ANALYSIS : CHARTS : Edge Trader Plus - To Central Bankers: You Are Golden Toast On A Silver Spoon
Wall St. Cheat Sheet - Are the Gold Haters Getting it Terribly Wrong?
AUDIO (22:06) : Ellis Martin - Ellis Martin Report with David Morgan--Satisfaction and Opportunity in Chaotic
Seeking Alpha - World Physical Gold Demand Goes Parabolic
The Globe and Mail - Where eight renowned investors think commodity prices are going Frank Giustra say's “If I am wrong, if this gold bull market is over, I will stand in the centre of Robson Square and I will sing Patsy Cline’s "So Wrong" wearing ladies’ underwear.”
Summary & VIDEO (01:44) : Bloomberg - Chinese Gold & Silver Exchange Society Runs Out of Gold... Importing from Switzerland and London
The New York Times - Part-Timer's Want More Work But Can't Find It
VIDEO (42:32) : YouTube - The Secret World Of Gold - Full & Complete Program
Great Falls Tribune - Baseball's Jackie Robinson inspired us all
04/19/13 - Bullion News
Investing - Gold gains on physical demand, tracks euro's gains
Silver Coins Today - Sales Spring for 2013 Bullion and Proof Silver Eagle Coins
MND - 10 Signs The Takedown Of Paper Gold Has Unleashed An Unprecedented Global Run On Physical Gold And Silver
The Telegraph - Speculative traders caused gold to crash, says WGC
ETF Guide - Dr. Copper is Sick and Here’s Why It’s a Problem
Business Insider - JIM RICKARDS: Here's The Difference Between 'Paper' Gold And 'Physical' Gold
VIDEO (04:35) : Bloomberg - China Has `Enormous' Appetite for Gold
The Hindu - Gold makes the vanishing act
Gold Made Simple - Ron Paul on the price drop: weak holders had to get out, and the strong holders are back and buying
My Budget 360 - US households are tapped out on debt: While US households are forced to eat austerity measures financial institutions load up on debt and purchase assets at rock bottom prices
Armstrong Economics - Inflation v Deflation
Bloomberg - Paulson Tells Clients Central Bank Purchases to Back Gold
MoneyWeb - Krugerrand demand skyrockets
04/18/13 - Bullion News
Investing - Gold gains on weak U.S. factory data, rising physical demand
China Daily - No winner in competitive currency devaluation says Yi Gang, deputy governor of the People's Bank of China
TECHNICAL ANALYSIS : CHARTS : Acting Man - Gold – What We Like and What We Don’t Like
Deviant Investor - Score: Banksters Two, Gold & Silver Zero
Dollar Collapse - For Gold, Friday’s COT Report Is Huge
MineWeb - Gold’s sell off, physical strength
Daily Wealth - Incompetence
Peak Prosperity - Unintended Consequences Are Increasing World Demand for Gold
SLIDESHOW : Business Insider - JIM RICKARDS: Here's How To Trade In A World Of Currency Wars And Potential Collapse
Futures Magazine - Gold crash leads to unprecedented physical demand
Financial Sense - What Is Pushing Down the Gold Price?
CoinNews - U.S. Mint at San Francisco, Coining Press Room
U.S. Global Investors - Four Important Facts to Remember About Gold by Frank Holmes
04/17/13 - Bullion News
Investing - Gold drops after IMF cuts global growth forecast, dollar gains
The New York Times - Japanese See Gold as Hedge Against Stocks and Yen
VIDEO (06:30) : Bloomberg - Gold Price Drop Not Based on Fundamentals, Catherine Raw, fund manager at BlackRock Inc. Says
TECHNICAL ANALYSIS : CHARTS : Sunshine Profits - Is This the End of the Bull Market in Gold and Silver?
VIDEO (06:44) & Article : The Age - Golden times for Perth Mint
VIDEO (07:40) : TECHNICAL ANALYSIS : CHARTS : CNBC - Cramer: Will Gold Turnaround?
Gold and Silver Blog - Physical Demand For Gold and Silver Skyrockets – Gold Bullion Coin Sales Highest Since December 2009
Futures Magazine - Cyprus finance minister sees gold sale within next months
TECHNICAL ANALYSIS : CHARTS : SafeHaven - Gold and Silver as a Macro Sign Post
AUDIO (36:37) : McAlvany Weekly Commentary - Record Gold Sell-off, How and Why
VIDEO (40:58) : Sprott Mgmt - Eric Sprott at Mines and Money Hong Kong 2013
TECHNICAL ANALYSIS : CHARTS : Prometheus Market Insight - Stock Market Speculative Advance Nears End
GulfNews - Gold in short supply in Dubai
VIDEO (03:50) : CoinWeek - CoinWeek’s David Lisot with Fox Business News Host Stuart Varney on Golds Biggest Pullback in 30 Years
The Telegraph - Fed and Bank of Japan caused gold crash
Summary & VIDEO (11:44) : MINING - Gold price fall to be probed by market regulators
CitizensVoice - Man charged with selling counterfeit gold, silver
Wall St Daily - What Would You Ask Investing Legend, Jim Rogers?
04/16/13 - Bullion News
Investing - Gold rebounds amid bottom fishing, U.S. data supports
ANALYSIS : CHARTS : Peak Prosperity - This Gold Slam is a Massive Wealth Transfer from Our Pockets to the Banks by Chris Martenson
National Interest - The Meaning of Gold's Plummet
Merk Investments - Merk Gold and Currency Outlook
Daily Resource Hunter - Gold Bears Won’t Have The Last Laugh, Here’s Why…
SilverSeek - The Price Smash – Who, What, How and Why? by Ted Butler
ANALYSIS : CHARTS : Advisor Perspectives - What Inflation Means to You: Inside the Consumer Price Index
Numismaster - Physical Bullion Demand on Fire
VIDEO (01:44) : CNN Money - Behind the scenes of a gold dealer
Casey Research - Gold: Fear vs. Greed – and Taxes
TECHNICAL ANALYSIS : CHART : Market Anthropology - Relatively Speaking...
VIDEO (02:00) : Bloomberg - Miners Margins Feel Pinch From Gold Price Drop
MineWeb - What will a collapsing gold price do to gold production?
ZeroHedge - Why Is Gold Crashing?
Daily Reckoning - Bring on the Gold Correction by Bill Bonner
Sovereign Investor - Don’t Sell Your Gold!
Wealth Daily - Cyprus Gold Bullion Sale
04/15/13 - Bullion News
TECHNICAL ANALYSIS : CHART : Inside Futures - Where to Buy Gold
TECHNICAL ANALYSIS : CHARTS : Gold Made Simple - Gold price suffers its third 25+% drop since the bull market started in 2001
Mish's Blog - Gold, Silver Hammered; End of the Precious Metals Bull Market? What's Next?
Deviant Investor - Silver – A Bipolar Roller Coaster
AUDIO (53:09) : Peak Prosperity - Mike Maloney: Today's Low Gold & Silver Prices Are Not Realistic
NewsMax - Investor Jim Rogers Says Gold Needs Correction, Isn’t Buying Yet
People's Daily Online - Low bullion prices lure shoppers
TECHNICAL ANALYSIS : CHARTS : Market Anthropology - Just Before the Crash
Market Watch - Gold plummets, but not at jewelry store
Edge Trader Plus - The Cyprus-ization Of Precious Metals
GulfNews - Purchasing goes up as gold drops
ANALYSIS : CHARTS : Futures Magazine - How the gold market was crashed
TECHNICAL ANALYSIS : CHARTS : Prometheus Market Insight - Gold Consolidation Formation Breaks Down
04/13/13 - Bullion News
CPI Financial - Precious Metals Report: Gold under pressure
VIDEO (08:13) : McalvanyFinancial - Why is Gold and Silver pulling back? Whats next?
CoinNews - Gold, Silver Plunge in Weekly Loss; US Bullion Coins Surge
AUDIO (05:38) : Bloomberg - Faber: Gold Isn't Down as Much as Apple
CEO.CA - What Should Gold Investors Do?
TECHNICAL ANALYSIS : CHART : Acting Man - Gold Breaks Support – What Now?
Wall Street Pit - Who is Holding All Those U.S. Dollars?
The Globe and Mail - Reports of bullion sale in Cyprus send gold plunging
TECHNICAL ANALYSIS : CHART : Edge Trader Plus - Gold And Silver – Bullish Hopes In Bear Market, Trend Wins
04/12/13 - Bullion News
TECHNICAL ANALYSIS : CHART : Kitco - Gold Pounded Below Major Psychological Support at $1,500, as Long-Term Chart Damage Now Begins to Set In
VIDEO (13:39) : TECHNICAL ANALYSIS : CHARTS : The Technical Traders - Friday Precious Metals Melt-Down.... How to Manage It
ANALYSIS : CHARTS : The Daily Gold - Silver is Following its 1970s Pattern
VIDEO (05:43) : CNBC - Metals Meltdown: Gold In Bear Market
Market Watch - Why gold and silver are in the dumps
Bullion Vault - How to Avoid Fake Gold Bars & Coins
VIDEO (04:33) : Bloomberg - Gold Plunges...
Daily Mail - 30 SECOND GUIDE: Who has the most bullion stashed in their gold reserves?
Coin Update - Latest Isle of Man “Cat” Crown Launched
BBC - Portugal and Ireland to be given more bailout repayment time
Burton Mail - Silver coins treasure hoard found on farm
04/11/13 - Bullion News
TF Metals Report - Unencumbered GoLD
Kitco - Where are the Stops? - Thursday, April 11: Gold and Silver
Merk Investments - Fed Exit? What Exit? Gold & Dollar Implications
Gains, Pains & Capital - Why Lie About Inflation? Because It Covers Up Bigger Lies
Deviant Investor - A Tipping Point In The Financial System – Part 2
Consumerist - Brooklyn Grandma Finds $100K In Safety Deposit Box, But Can’t Keep It
VIDEO (02:12) : Sound Money Campaign - The Power to Create Money
ZeroHedge - Cyprus Denies Gold Sale
Dollar Collapse - Welcome to the Currency War, Part 7: The Zero Sum Game
INVEZZ - Daily Forex Outlook: Yen (JPY) Extends Slide vs. Greenback (USD) on Fed Minutes
Profit Confidential - U.S. Dollar to Become Next Japanese Yen?
MoneyNews - James Rickards: ‘Gold Never Changes Its Value,’ Currencies Do
Wall Street Pit - Beware of Parabolic Stock Charts
VIDEO (02:47) : CNBC - Bitcoin: 'Be Careful Where You Put Your Dough' Warns Santelli
Forbes - Bitcoin or Gold: Which is More Fiat-Proof?
04/10/13 - Bullion News
Article : TECHNICAL ANALYSIS : CHARTS : MoneyWeek - There’s life in gold yet
VIDEO (04:43) : CNBC - Time to Go For the Gold?
Mish's Blog - Fools in Cyprus to Sell Gold, Hike Corporate Taxes to Finance Small Part of Bailout
MineWeb - Sprott Asset Management's John Embry discusses how he sees the current global financial situation ending and why he likes both gold and silver
Money Watch - Fed caught flat-footed by lousy hiring figures
VIDEO (22:00) : Gordon T Long - Macro Analytics - Something For Nothing Societies w/ Ty Andros
PCWorld - Of Bitcoins and e-bullion: The sad history of virtual currency
Moneda De Plata - Of bubbles and Bitcoins by Hugo Salinas Price
AUDIO (35:48) : McAlvany Weekly Commentary - Japanese Currency Attack: Welcome to the Next World War
Resource Investor - Gold record high in yen sees rush to sell jewelry, buy coins and bars
Spiegel - Harvard Economist: 'The Crisis Isn't Over in the US or Europe'
Gains, Pain & Capital - Why Are Central Banks Buying Gold?
VIDEO (06:14) : Bloomberg - Gold Tumbles After Release of Fed Minutes
ANALYSIS : CHART : Advisor Perspectives - Chained CPI Versus the Standard CPI: Breaking Down the Numbers
The Blaze - The Major Budget Issue Both Parties Are Getting Very Wrong
04/09/13 - Bullion News
TECHNICAL ANALYSIS : CHARTS : Sunshine Profits - Transportation-Industrial Stocks Ratio Hints at Higher Precious Metals Prices
Kitco - Where are the Stops? - Tuesday, April 9: Gold and Silver
CHARTS : GoldSilverWorlds - Jim Rickards: Gold Is Always Rallying Somewhere
VIDEO (03:25) : Bloomberg - Hayman Capital Management Managing Partner and Principal Kyle Bass : I'd Much Rather Own Gold Than Paper
Midas Letter - Gold, Silver Prices Seen Rising on Global Stimulus
TECHNICAL ANALYSIS : CHARTS : Gold Made Simple - Gold price rises 1% on the day as it nears $1590 – back above crucial 700 day moving average
AUDIO (01:15) : YouTube - Eric Sprott - A Rude Awakening In Metals
The New York Times - America’s Most Profitable Export Is Cash
Article & VIDEO (04:44) : Mish's Blog - Euro-Skepticism was Thatcher’s Most Relevant Legacy; Had Europe Only Listened
ZeroHedge - The Day The Government Seized Americans' Gold - April 5th 1933
CMI Gold and Silver - IMF head praises BoJ’s monetary revolution

Affiliate Ad
04/08/13 - Bullion News
Investing - Gold prices slide as investors take profits from U.S. jobs report rally
CHART : ZeroHedge - 80% Chance Of 40% Silver Short Squeeze
TECHNICAL ANALYSIS : CHARTS : GoldSilverWorlds - Silver Sentiment Reaches Extreme Levels
Market Watch - Palladium’s poised for a 22% gain by the end of 2014: Capital Economics
Inside Investing Daily - This is Not a Rally...It's a Credit Bubble of Epic Proportions
ANALYSIS : CHARTS : Prometheus Market Insight - Monetary Data Continue to Reflect Structural Economic Weakness
VIDEO (10:12) : BNN - John Embry: Gold Price Manipulation – On the Rise?
Deviant Investor - Dirty Harry to World Savers “You’ve Got To Ask Yourself… – Do You Feel Lucky?
BD Daily - How the US Herds the ‘Sheep’ Away from the Gold Market
SGT Report - Bash-and-Buy Soros at it again !!
TECHNICAL ANALYSIS : CHARTS : Gold Made Simple - Gold price dips at start of the week as gold priced in Yen moves 9% higher in just three days
Article & VIDEO (25:01) : SafeHaven - Japan: A New Currency War Front
VIDEO (03:00) : CNBC - Will BOJ Buying Sink Yen?; Interview with Axel Merk
China Daily - Australia eyes conclusion of FTA talks with China
Bloomberg - Trust in Gold Not Bernanke as U.S. States Promote Bullion
AdvisorOne - After Stockton, Economist Sees More Pain in California and Beyond
MineWeb - New Dubai gold and PM refinery to be one of world’s largest
04/07/13 - Bullion News
TECHNICAL ANALYSIS : CHARTS : Gold-Eagle - Markets Correcting...Metals In Limbo
MineWeb - Gold to remain in demand medium to long term - Commerzbank
VIDEO (13:50) : Max Keiser - David Morgan & Max Keiser talk SILVER
Seeking Alpha - Dismal Labor Report Gives Precious Metals Markets New Life
TECHNICAL ANALYSIS : CHARTS : SafeHaven - Gold - Are We There Yet?
CPI Financial - Precious Metals Report: Gold showing little resistance to price weakness
South China Morning Post - China looking at direct yuan trade with Aussie dollar
Market Watch - Krugman-Stockman TV debate fizzles
The Telegraph - Bear market for gold still gleams tantalizingly thanks to money-printing
TECHNICAL ANALYSIS : CHARTS : Gold-Eagle - Is Panic Selling Marking A Bear Market Bottom In Precious Metals And The Miners?
South China Morning Post - China looking at direct yuan trade with Aussie dollar
Forbes - Protecting Yourself From Japanese Insanity
Digital Journal - 400-year-old treasure found at shipwreck site in Gulf of Mexico
04/06/13 - Bullion News
CoinNews - Gold, Silver Jump Friday, but Fall on Week; US Bullion Coins Robust
Trader Dan's Market Views - Hedge Funds Target Silver
Christian Science Monitor - Americans pile into silver, gold coins
Market Watch - Why gold fell this week and what to do next
telegram - Treasure hunters finding trouble, in Santa Fe, NM
Mish's Blog - Canada Unexpectedly Sheds 54,500 Jobs in March; Worst Job Loss in 4 Years; Canadian Dollar Tumbles
Economic Collapse News - 10 wise ways to spend your tax refund this year
The Daily Mail - Inside the real-life panic rooms of the rich and famous: Hidden chambers behind fireplaces, bookcases and inside a wardrobe
04/05/13 - Bullion News
Investing - Gold prices gain as weak U.S. jobs numbers quash talk of Fed move
TECHNICAL ANALYSIS : CHARTS : Sunshine Profits - Gold Price Breakout & Breakdown
VIDEO (02:16) : CNBC - Santelli: 'Pipe's Broken' & 'Debt Lasts Forever'
MetalMiner - US Palladium, Gold Prices Support Monthly Index as Silver Looks Weaker
Kitco - Where are the Stops? Friday, April 5: Gold and Silver
Silver-Coin-Investor - Tungsten Silver? Or More Salt in the Open Wound?
TECHNICAL ANALYSIS : CHARTS : 321gold - Gold Battlefield Technical Update
VIDEO (56:48) : The Big Picture - Stockman, Orszag in Budget Battle Royale
Summary & VIDEO(s) : ZeroHedge - George Soros Warns "Central Banks Are Creating Financial Instability"
CoinNews - 2013 American Eagle Bullion Coins Robust in First Quarter Sales
ANALYSIS : CHARTS : Ahead of the Herd - Buying Dead Flowers
CHART : GoldandSilverWorlds - Yen Gold On Fire Today
My Budget 360 - The un-American savings rate: Americans savings rate heads to a record low. Americans saving about 2 percent per year and the near extinct pension
VIDEO (04:22) : BizAsiaAmerica - Jim Rickards on the EU Economic Crisis
XINHAUNEWS - U.S. Fed hints monetary stimulus to continue
Perth Mint Bullion - US Survey Backs Perth Mint Findings On Customer Attitudes To Gold
ZeroHedge - "Don’t Rush For Gold" - What A Real Hard Currency Mine Looks Like
04/04/13 - Bullion News
Investing - Gold prices inch up on fears of weak U.S. jobs report
Kitco - Where are the Stops? Thursday, April 4: Gold and Silver
Seeking Alpha - Sell Your Gold And Silver Now
MineWeb - Mine production hits record but jewellery fabrication drops - GFMS
ANALYSIS : CHARTS : Advisor Perspectives - Labor Force Participation Rate Since 1987: Some Eerie Demographic Trends
AUDIO (31:04) : McAlvany Weekly Commentary - About this week’s show: The Fed – watch what they DO and not what they SAY, Equities and Real Estate – new bull market?, Gold and Silver – New York’s negative bias
INFO~GRAPHIC : Wealth Wire - America's Debt Visualized
Numismaster - Bullion Palladium, No? Collector, Yes
VIDEO (04:59) : CNBC - El-Erian: Three Things Cyprus Tells Us About Europe (Full Interview)
Reuters - BOJ to pump $1.4 trillion into economy in unprecedented stimulus
Deviant Investor - A Tipping Point In The Financial System
TECHNICAL ANALYSIS : CHARTS : Gold Made Simple - Gold price back down to the bottom of its 2 year trading range
CoinNews - US Mint Sales: Proof Coins Best, Proof Silver Eagle Tops 400K
FX Empire - Is it possible for Silver to touch 50$ in 2013?
The Epoch Times - Demand for Gold Mixed - Calculating the true cost of mining gold
Seeking Alpha - Ace In The Hole - Another Way To Play The Silver And Gold Card
VIDEO (00:28) : BBC - Ton of gold bullion hidden in car on Swiss border
04/03/13 - Bullion News
ANALYSIS : CHART : Rick Ackerman - Gold Close to Trashing a Key Support
TECHNICAL ANALYSIS : CHARTS : Trader Dan's Market Views - Gold, Crude Oil and Copper Break Down
Barron's - Emerging Markets: Embracing the Gold Standard?
Seeking Alpha - U.S. Mint Sales For March: U.S. On Pace To Use All Domestic Mine Production For Silver Eagles
MineWeb - The gold bear market and the importance of investment - CPM
The Gold Report - David Stockman: Welcome to Irrational Exuberance 2.0
Daily Reckoning - Reading The Dow v. Gold Ratio, Part II
Casey Research - Doug Casey: All Banks Are Bankrupt
The Daily Mail - Are you ready for a gold rush? Will money fears and tight supply spark a rise, or has the best been seen?
Business Standard - Acute shortage of gold in south India
China Daily - BRICS a force despite "ifs" and "buts"
Consumerist - Macy’s Plays April Fools’ Joke On Itself With Typo Marking Down $1,500 Necklace To $47
Catholic Online - Could the World's Entire Gold Supply be Melted into Cube, 67 Feet on All Sides?
BBC - Haruhiko Kuroda says Japan's debts are not sustainable
Daily Reckoning - He Is Risen! by Bill Bonner
04/02/13 - Bullion News
Investing - Gold prices fall as eurozone jobs data sparks profit taking
VIDEO (17:12) : TECHNICAL ANALYSIS : CHARTS : The Technical Trader - April 2nd Trading Setups for Gold, Silver, Miners and SPX
Money Morning - With the White-Hot Demand for Coins, Why Are Silver Prices Falling?
TECHNICAL ANALYSIS : CHARTS : Gordon T. Long - What OMF Means for GOLD
The Gold Report - Why Rick Rule Bought $280M of Platinum and Palladium
Casey Research - April Fools: Silver ETFs Signal Bears Are Wrong
Article & VIDEO (02:56 : KKCO NBC 11 - Beware of coin scams and misleading ads
TECHNICAL ANALYSIS : CHARTS : Trader Dan's Market Views - U S Dollar Remaining Firm
Daily Reckoning - Reading The Dow v. Gold Ratio, Part I
VIDEO (05:57) : Financial News Network - Eric Sprott’s silver lining to banking crises
CoinWeek - Silver 101 : THE WORLD OF EXPENSIVE SILVER
Article & VIDEO (25:13) : Of Two Minds - Debt = Serfdom
TECHNICAL ANALYSIS : CHARTS : Advisor Perspectives - Buy & Hold Gold: A Broken Strategy?
GoldSilverWorlds - The Great Disconnect Between Paper & Physical Silver
The Golden Truth - Death by 1000 Paper Cuts
VIDEO(s) : The Royal Mint - Top ten coin related videos

Apples of Gold - Customer Reviews - 4.9 stars
For Bullion Market News...
|
Support this Guide & Paypal Thank You for Your Support |
|
|
 | |||||
Free Bullion Investment Guide

Recent Articles
-
Newsletter of the Free Bullion Investment Guide - April 2025
Apr 05, 25 08:19 PM
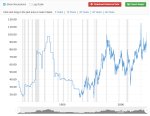 The April 2025 newsletter of the Free Bullion Investment Guide provides the latest updates, fundamental and technical gold and silver market analysis, the best articles from last month, and a list of…
 -
Latest Update (3/14/25) from the Free Bullion Investment Guide
Mar 14, 25 11:23 PM
Free Bullion Investment Guide's Latest Updates: Mexican Gold and Silver Libertad - 2024 Mintage Figures & more... -
Newsletter of the Free Bullion Investment Guide - February 2025
Feb 12, 25 03:58 PM
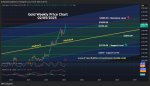 The February 2025 newsletter of the Free Bullion Investment Guide provides the latest updates, fundamental and technical gold and silver market analysis, the best articles from last month, and a list…
 -
Newsletter of the Free Bullion Investment Guide - January 2025
Jan 13, 25 11:28 AM
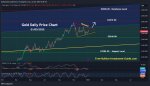 The January 2025 newsletter of the Free Bullion Investment Guide provides the latest updates, fundamental and technical gold and silver market analysis, the best articles from last month, and a list o…
 -
Newsletter of the Free Bullion Investment Guide - December 2024
Dec 12, 24 08:43 PM
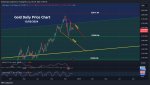 The December 2024 newsletter of the Free Bullion Investment Guide provides the latest updates, fundamental and technical gold and silver market analysis, the best articles from last month, and a list…

18W LED Security Light (Dusk to Dawn & Motion Sensor) - $32.99
from:
 LED Lighting


Keep this Guide Online
& Paypal
Thank You for
Your Support
Search the Guide
| search engine by freefind | advanced |

Daily
Newsletter
Mintages
for
2024
Gold & Silver Mexican Libertad
|
Gold Libertads |


Chinese Gold Coin Group Co.
& Chinese Bullion


2025
Gold & Silver Chinese Panda

|
Silver Panda |


Help Us Expand our Audience by forwarding our link
www.free-bullion-investment-guide.com.
Thank You!
March's

All Articles were Originally Posted on the Homepage


Click Ad to Request a Free Appraisal Kit
ExpressGoldCash
Customer Reviews 4.9 stars


Polar Bears Privy
Give a lasting gift of the iconic Gold Maple Leaf bullion coin with a special privy mark. [More]
Free Shipping on Orders over $100 (CDN/USA)

