Homepage / Archived News or Quarterly News / 2nd Quarter 2012
2nd Quarter - 2012
Charts, Bullion News & Commentary
When investing in any market, a good way to judge price movement in the future is to learn from the past.
The charts and bullion news links on this page are largely devoted to the precious metals market during the 2nd Quarter of 2012.
Every news LINK was originally posted on this guide's homepage.
The charts below are provided courtesy
Gold Price Chart - 2nd qtr. 2012
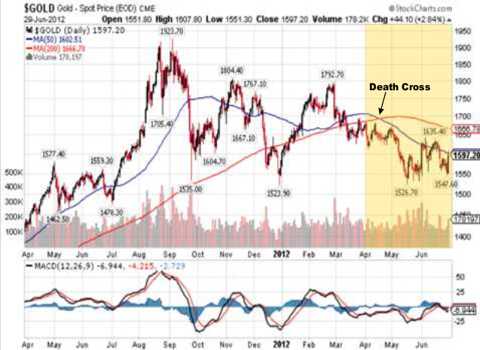
Gold Price Chart (Apr. 1st, 2011 - June 30th, 2012)
Bullion News
Gold Price Summary
The Death Cross formed in gold's price chart early in the second quarter of 2012 was a helpful indicator for investors deciding which direction the price of gold was heading.
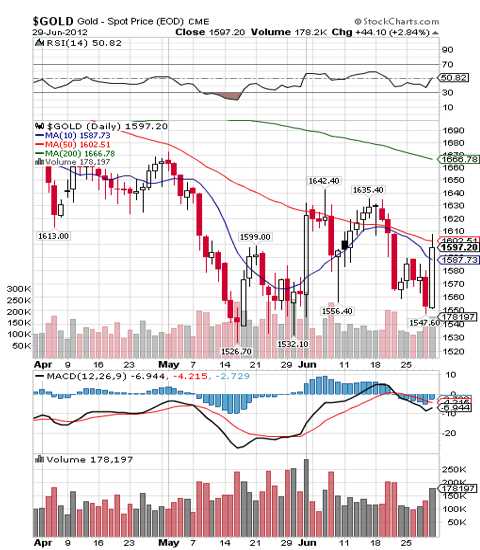
The price of gold reached its lowest point in mid-May at $1526.70 and began to show signs of a new upward trend, indicating that bottom resistance was increasing.
Gold Price Chart (Apr. 1st, 2012 - June. 30th, 2012)
Bullion News
Silver Price Chart - 2nd qtr. 2012
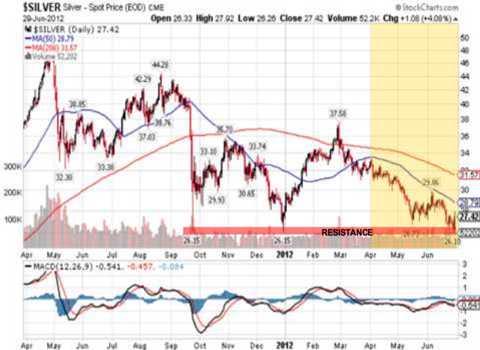
Silver Price Chart (Apr. 1st, 2011 - June. 30th, 2012)
Bullion News
Silver Price Summary
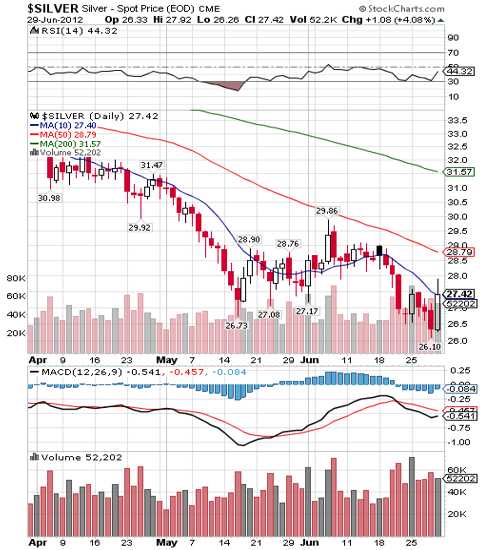
For much of the second quarter, silver's spot price traded sideways or found a new bottom. Each time the price tested a new low, it created a support resistance level around the $26.00 range.
Silver Price Chart (Apr. 1st, 2012 - June. 30th, 2012)
Bullion News

Apples of Gold - Customer Reviews - 4.9 stars
Platinum Price Chart - 2nd qtr. 2012
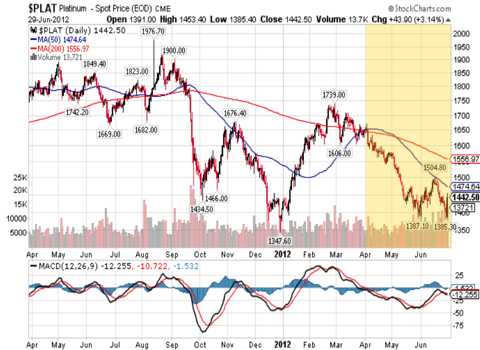
Platinum Price Chart (Apr. 1st, 2011 - June. 30th, 2012)
Bullion News
Platinum Price Summary
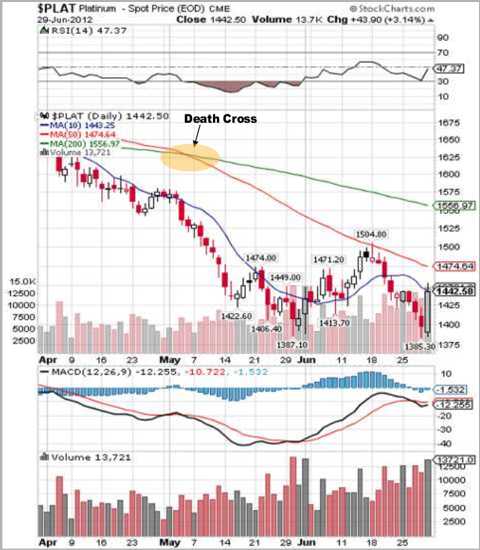
Platinum's 2nd quarter spot price was falling on low volume during the
the first month of the quarter.
In early May, the 50-day moving average fell below the 200-day moving average, creating a Death Cross which is usually a good indicator of lower prices in the future.
Platinum's spot price consolidates for the rest of the quarter and tests
two new lows, first at $1387.10 in late May and $1385.30 at the end of
the 2nd quarter of 2012.
Platinum Price Chart (Apr. 1st, 2012 - June. 30th, 2012)
Bullion News
Note: A Death Cross or a Golden Cross are Technical patterns; a Death Cross indicates/predicts a declining asset price, whereas a Golden Cross indicates/predicts a rising asset price.
Palladium Price Chart - 2nd qtr. 2012
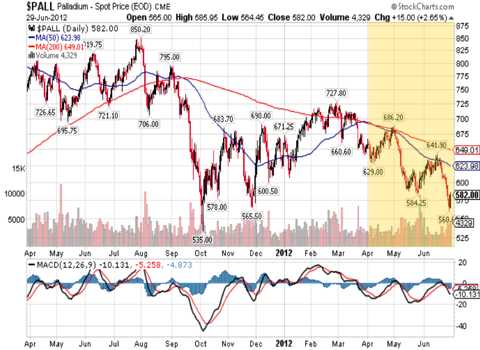
Palladium Price Chart (Apr. 1st, 2011 - June. 30th, 2012)
Bullion News
Palladium Price Summary
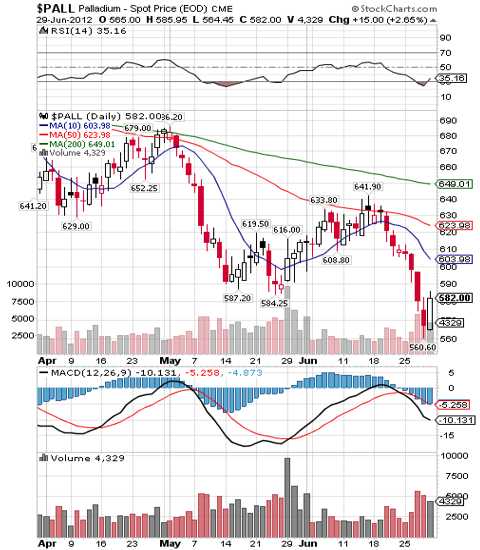
Palladium's spot price chart was largely consolidating during the quarter, testing lower prices for support. In the second quarter of 2012, palladium's spot price experienced two lower highs and three lower lows.
Palladium Price Chart (Apr. 1st, 2012 - June. 30th, 2012)
Bullion News
The charts above are provided by the courtesy of
2nd Quarter - 2012
Bullion News & Commentary
The Quarterly News starts with the end of the quarter articles, first.
Please be aware that not all of the links below are working; they have been retained because the headlines provide information on the state of the markets at the time.
06/30/12 - Bullion News
AUDIO (27:43) - Ellis Martin Report with David Morgan and Paul Mladjenovic--Obamacare and the New Amerika
Silver Coins Today - Silver Ends First Half of 2012 Lower; Eagle Coins Top 17M
MineWeb - Gold down to $700 - or up to $7,000? - Diametrically opposed viewpoints
Financial Sense - Jim’s Big Picture: The Supreme Court Has Dropped the Healthcare Hammer-What does it mean to you personally?
Examiner - Metal prices surged copper and silver demand is expected to pick up
MoneyNews - St. Louis Fed’s Bullard: More Easing Would Risk Inflation Surge
06/29/12 - Bullion News
AUDIO (35:53) : TFMetals Report - Econ 101 with John Williams
Profit Confidential - Largest U.S. City So Far to Declare Bankruptcy
CNBC - Here Are Four Good Reasons Not to Trust Today's Rally
VIDEO (06:44) : CNBC - EU Debt Deal Only Making Problems Worse: Jim Rogers
Numismaster - Cracking Down on Fake Chinese Coins
Resource Investor - How to Buy Silver Online
TECHNICAL ANALYSIS : GoldScents - THE CRB JUST FORMED A FINAL THREE YEAR CYCLE LOW
VIDEO (28:05) : Capital Account - Nigel Farage on the Failings of the EU Summit and an Antidemocratic Europe
MoneyNews - Reuters Poll: Wall Street Boosts Odds Fed Will Have to Ease Again
06/28/12 - Bullion News
Business Insider - Regulators Are Looking Into Labeling Gold A Tier 1 Asset
AUDIO (48:11) : Ricochet - Gold Buggery
CMI Gold and Silver - The Keynesian endgame
Wealth Daily - Invest in Silver not Gold
Arabian Money - How much deflation before we get to the hyperinflation of money printing?
Market Watch - Inflation lobby is about to win the argument
Bullion Street - Sudan considers Gold as a currency and reserve
azizonomics - Fiat Money Kills Productivity
Silver Coins Today - Demand Rises for US Silver Coins, Led by Silver Eagle Products
Casey Research - Doug Casey on the Coming Eurocrash
GoldSeek - Gold Bullion Coin - 1 Tonne Australian Kangaroo - Enters Guinness Book of Records
Silver Investing News - Silver: How to Call It and Play It
06/27/12 - Bullion News
Perth Mint Bullion - Snake Strikes Underway For Smooth Lunar Launch
Silver Coins Today - 2012 Chaco Culture 5 Ounce Silver Bullion Coin Sales Begin
MineWeb - India's Reserve Bank considering banning banks from selling gold coins
Daily Echo - Man allegedly sent fake gold sovereigns abroad
VIDEO (33:29) : USA Watchdog - One on One with John Williams
CNBC - Does the Global Economy Need More Money Printing?
POLL : Gallup - Americans' Confidence in Banks Falls to Record Low
AUDIO : MineWeb - Mitsui and Co Precious Metal's David Jollie looks at the current state of the platinum sector and where it is likely heading
US Funds - An Ending Made For Gold
VIDEO (28:05) : Capital Account - Chris Martenson on Shadow Bank Runs and how Central Banks are Missing the Boat!
azizonomics - Liquidation is Vital
Resource Investor - China & Russia Buy Bullion as Protection
06/26/12 - Bullion News
Political Metals - My Last Forecast on Silver and Gold Prices
CoinWeek - The Coin Analyst: Modern World Coin Collecting Strategies: Low Mintage Sleepers
Minyanville - What Are The Most Popular Silver Bullion Coins?
Perth Mint Bullion - Perth Mint Certificates Are Not Classed As 'Paper Gold' - GoldCore
Numismaster - How Do Coin Dealers Earn Their Income?
AUDIO : FSN - Peter Grandich Is Back With Encouraging Words About Precious Metals
Reuters - Gold coin sales from national Mints fall in Q1
VIDEO (04:43) : Yahoo (BreakOut) - Charles Nenner; Short Stocks and Bonds, Buy Gold
321gold - Deflation Inflation Debate
The Real Asset - The Golden Revolution – book review
The Gold Report - Platinum Outlook Remains Volatile: Erica Rannestad
AUDIO (66:07) : Financial Sense - Post-FOMC Macro Update with Chris Martenson
06/25/12 - Bullion News
CoinWeek - Defining The Line Between Precious Metals and Numismatics
VIDEO(s) (30:33) : Political Metals - Silver Bomb
Chicago Tribune - Nearly half of Americans -- 49 percent -- Don't have enough Emergency Savings
Bloomberg - Central Banks Commit to Ease as Threat of Lost Decades Rises
ZeroHedge - The Consequences Of The Unthinkable: Here Is What Happens When The Euro Breaks Up
VIDEO (26:58) : Rolling Stone - Taibbi Joins Yves Smith on Moyers
American Thinker - Euro Crisis and the Twilight of Sovereignty
msnbc - Anxiety rises and wealthy rush to Swiss banks
06/24/12 - Bullion News
Smart Money - The Economic Police State - Hoenig: Government intervention in the economy destroys wealth -- and freedom.
VIDEO (16:57) : Physical Precious Metals Vs. Mining Shares
ChicoER - Antique appraiser shares some tips
06/23/12 - Bullion News
CoinNews - Gold, Silver Plunge on Week, US Mint Coin Sales Soar
Sprott Asset Mgmt - Ministry of [Un]Truth
The Gold Report - Gold and Silver Are on the Verge of Something Huge
The Golden Truth - A Quick Primer On Why Operation Twist Is QE
The Ledger - Bad Checks from Gold Buying Company Hit Local Customers
Palm Beach Post - Storage Wars: Finding gold (or silver) in those unclaimed units
NY Post - Judge likens Goldman logic to Orwell’s ‘1984’
Nasdaq - JP Morgan: Every Cloud Has a Silver Lining
AUDIO (20:55) : Future Money Trends - Precious Metals Update with Ranting Andy Hoffman
06/22/12 - Bullion News
Summary & VIDEO (09:58) : ZeroHedge - Gold As A Store Of Value
ABC News - The Truth About Buying Gold
SafeHaven - Surprise Strength in Gold
Ahead of the Herd - Six Percent Can Draw Gold From The Moon
Summary & VIDEO (05:18) : Wealth Wire - 80% of the Gold the World Owns Doesn't Exist
CoinWeek - Liquidation Could Send Silver Down to $18
06/21/12 - Bullion News
Munknee - Eventual Rise in Interest Rates Will Be Downfall of U.S. – Here’s Why
Article & VIDEO (03:59) : The Cosumerist - Former Gold Buyers Say They Were Pushed To Lie To Customers
VIDEO (05:40) : Yahoo (BreakOut) - Monetary & Fiscal Policies of the Last 4 Years Have Failed: Jim Rogers
POLL : Rasmussen Reports - Just 16% Say Today's Children Will Be Better Off Than Their Parents
POLL : Rasmussen Reports - 66% Say Government Should Cut Spending To Help Economy
Perth Mint Bullion - The Land Down Under Could Be A Safe Place To Keep Your Gold - FSN
azizonomics - Skyscraper Index Indicates Next Global Crash in 2013
BreitBart - Fed Cuts Growth Estimate Again
VIDEO (02:44) : Clarke and Dawe - The European Crisis
Business Insider - Russia's Central Bank Just Bought 500k Ounces Of Gold
Bullion Street - Ghana may withdraw Gold reserves from euro zone banks
VIDEO (27:53) : Capital Account - Jim Rickards on the latest Federal Reserve Rate Decision and Operation Twist 2.0
06/20/12 - Bullion News
Perth Mint Bullion - Silver Seasonality
CoinWeek - The Coin Analyst: Gold’s New Role in the Global Monetary System and the Euro Zone Crisis
VIDEO (06:33) : Nigel Farage: "Listen! The Whole Thing's a Giant Ponzi Scheme!"
Safe Haven - Gold Becomes a Tier 1 Asset Class for Banks
CNBC - Fed 'Prepared to Take Further Action' If Economy Slows
Bullion Street - Turkey-Iran annual trade involves Gold up to 82 tons
Acting Man - Gold, A Quick Take
AUDIO (09:50) : MineWeb - Copper risks still biased to the down side - Standard Chartered
06/19/12 - Bullion News
Financial Sense - Does Gold Keep Up In Hyperinflation?
NuWire Investor - How to Collect Coins as an Investment
MoneyWeek - The US will print more money this year – here’s how to profit Arabian Money - Higher gold, silver and interest rates to result from the euro crisis
Silver Investing News - Will Congress Aggravate Silver Manipulation?
Coin Update - Perth Mint Gold and Silver Bullion Sales Rose in May
Numismaster - Do You Know What You Are Buying?
POLL : Rasmussen Reports - 52% Think Economy Will Be Unchanged or Weaker A Year From Now
06/18/12 - Bullion News
Wall St. Cheat Sheet - Will Europe Provide the Final Catalyst for Gold and Silver?
Clive Maund - HEADS A DEFLATIONARY IMPLOSION - TAILS A HYPERINFLATIONARY DEPRESSION...
CMI Gold and Silver - QE3 is a given
VIDEO (05:01) : CNBC - Will Central Banks 'Inflate' Their Way Out of Debt?
Seeking Alpha - Western Central Banks Print Money, Emerging Market Central Banks Buy Gold
321gold - Monthly Gold Pattern Remains Bullish
Wealth Daily - How to Avoid the Global Debt Debacle; World to Europe: Print More Money!
VIDEO (14:16) : USA Watchdog - One on One with Karl Denninger
American Thinker - Shrinking Local Governments
Seeking Alpha - Physical Precious Metals Versus Their ETFs: Which Is Best For You?
Fox News - Decision clears way for Gold Rush-era ship recovery mission
06/17/12 - Bullion News
CNBC - Short-Term Gold Options Get Physical
Smart Money - Bond Rates May Not Go Up for Years
The Southern - Gold — Making an All-Time High?
Wealth Wire - Revisiting the First Silver Bubble
Commodity Online - Increasing easing hopes, disruptive political climate should boost Gold: HSBC
Huffington Post - Super-Rich Investing More In Treasure, Report Finds
06/16/12 - Bullion News
CoinNews - Gold, Silver, Metals Up on Week, Solid Sales of US Bullion Coins
Arabian Money - Back to the fundamentals of investing in silver
Seeking Alpha - The Silver Myth: Industrial Demand Isn't What's Driving Prices
SilverSeek - Is Silver Currently Riskier Than Gold?
ZeroHedge - Volatility Is Not Risk
AUDIO : FSN - Walter Williams – Government Can’t Always Give You What You Want
Summary & VIDEO (21:30) : Political Metals - Coming Soon! New 1:1 silver exchange that will suck metal away from the LBMA
New York Times - Hong Kong Exchange to Buy London Metal Exchange for $2.1 Billion
06/15/12 - Bullion News
SilverSeek - A Few Questions; One Answer by Ted Butler
Forbes - Gold As An Investment Vehicle? Here's How to Buy It
Free Gold Money Report - Fiat Currency in a Kondratieff Winter
AUDIO (14:32) : David Morgan: Silver to Gain Gradually in the Near-Term
Ahead of the Herd – Sweat of the Sun A Gift From the Magi
AUDIO (25:01) : FSN – Alasdair Macleod – Quiet Bank Runs Taking Place in Europe Now
Silver Doctors – Rick Santelli Interviews Bart Chilton on CFTC Incompetence
Rolling Stone – Senators Grovel, Embarrass Themselves at Dimon Hearing
VIDEO (05:33) : How Europe is assuring its own doom. Nigel Farage and Peter Schiff break it down.
Article & VIDEO (03:25) : Credit Writedowns – America’s slowdown is not about Europe, it’s about the debt
Arabian Money – Another Black Monday coming for global financial markets?
The Boston Globe – The Silver Institute: Silver is for Champions - Silver is Representative of the Best in Many Sports
VIDEO (04:33) & CNBC – A 'Golden' Opportunity Ahead of Greek Elections; Interview with Frank Holmes
06/14/12 - Bullion News
VIDEO (04:39) : Popular Video – If I Wanted America to Fail
POLL : Rasmussen Reports - 78% Remain Concerned About Inflation
ZeroHedge - Tony Robbins Bullish On Gold - Faber and Bass His Financial Gurus
MoneyWeek - Has the gold price bottomed out?
AUDIO (69:31) : Stansberry Radio - Why Uncertainty Leads to Great Opportunities, Interview with Jeff Clark
Perth Mint Bullion - Update: Central Bank Gold Holdings
Financial Sense - What Will It Take?
Bullion Street - Olympic medals are from biggest man-made hole on Earth
MoneyShow - Paul Krugman’s Rusty Chains
VIDEO (20:06) : Hugo Price and Max Keiser can save Greece, edited for English
06/13/12 - Bullion News
AUDIO : FSN - Jeff Clark – Precious Metals Are Your Savings
AUDIO (17:34) : James Turk-It All Comes Down To A Golden Education
Fox Business - Gold and Silver Are Your Hedge Against Centrally-Planned Economies
VIDEO (01:12) : ZeroHedge - Hannan: "The Euro Is The Problem, Not The Solution"
Fast Markets - Technical Analysis - Dollar Index - Despite all the turmoil in Europe, the dollar is drifting
CoinWeek - Gold: Foreign Central Banks Versus The US Government
AUDIO (13:11) : MineWeb - Recent moves signal change in market perception to gold
ZeroHedge - Retail Sales Miss Ex-Autos, PPI Misses; Gold Soars On More QE Expectations
VIDEO (04:27) : The Daily Caller - MILTON WOLF: Free market capitalism ‘doesn’t work.’ Oh, really?
azizonomics - Inflationeering
VIDEO (02:27) : CME Group - Copper Futures w/ George Gero
Bullion Street - Supplies of Platinum may decline this year: Johnson Matthey
Supply Management - Pressure on platinum prices halts mining activity
Acting Man - Pleas for More Spending and Money From Thin Air, Stimulus Failure Unearthed
BreitBart - Detroit City Council Refuses To Drop Lawsuit That Will Bankrupt Detroit in Four Days
06/12/12 - Bullion News
AUDIO : FSN - Charles Biderman – Gold & Silver For the Long Haul – Short Term Trends Aside
CoinWeek - Perth Mint Excludes U.S. Customers From Direct Dragon Proof Coin Sales
VIDEO (28:15) : Capital Account - From Crowd Funding Europe's Future to the Future of Gold and the US Dollar!
VIDEO (08:27) : CNBC - Jim Rogers: Let Spain, Greece Go Bankrupt
Investment Rarities - CONTAGION by Jim Cook
VIDEO (01:46) & Article : WJLA (Washington, DC) - Coin thefts on the rise
Liberty Blitz Krieg - Spain’s Bailout in One Photo
VIDEO (21:24) : The Real Asset - Interview with John Butler
ZeroHedge - The US "Budget Surplus" Miracle Is Over: $125 Billion Deficit In May
GoldSeek - Inflation-Adjusted Prices
POLL : Rasmussen Reports - New High: 42% Worried They’ll Lose Their Money Due To Bank Failure
my budget 360 - How to lose 40% of your net worth in 3 years
06/11/12 - Bullion News
SilverSeek - Silver Could Preserve More Value Than Gold
Silver Doctors - Ned Naylor-Leyland Reveals Actual Owner of Bob Pisani’s GLD Gold Bar!!
VIDEO (15:01) : David Morgan Explains Why You Invest In SILVER
VIDEO (14:44) : Jim Rogers Greece Should have never joined the Euro
AUDIO (37:19) : Financial Sense - Eric Janszen on Hyperinflation vs. High Inflation
VIDEO (22:29) : USA Watchdog - One on One with Paul Craig Roberts
Profit Confidential - Why the “Only Way Out” Offered Won’t Work This Time
VIDEO (03:51) : CNBC - Why It Makes Sense to Buy Gold & Oil Now
azizonomics - Spreading the Wealth Around
The Money Show - Tear Up Your Paper Money
06/10/12 - Bullion News
The Southern - Gold vs. Silver — Who wins?
VIDEO (07:38) : YouTube - Pawn Stars: Silver Linings
Smart Money - Why Everyone Still Wants Dollars
VIDEO (08:36) : Metals react with VOLATILITY on QE3 Speculation (David Morgan/Butler On Business)?
Bloomberg - Tall Tales About China’s Banks Hide Economy’s Problems
VIDEO (04:31) : Yahoo - BreakOut - Central Banks Will Fuel Gold to $2,000 This Year Says Kilburg
06/09/12 - Bullion News
VIDEO (06:21) : Why Silver is Money
Money Morning - Why Lower Gold Prices Won’t Last
VIDEO (48:53) : Chris Martenson interviews Steve Keen: Why 2012 is Shaping Up to be a Particularly Ugly Year
Profit Confidential - U.S. Economy Following Path of Greece & Spain?
VIDEO (15:31) : Eric Sprott with Silver Doctors - Part I : THE SILVER CARTELS HAVE CHANGED THEIR M.O.
VIDEO (14:55) : Eric Sprott With Silver Doctors - Part II : There's No Gold to Buy!
06/08/12 - Bullion News
Fox Business - Week Ahead: Inflation Data and Earnings
Jesse's Café Américain - Gold Daily and Silver Weekly Charts - Monkey Shines
Daily Reckoning - Keynesian Policies: Half a Century of Failure
VIDEO (28:07) : Gonzalo Lira on a Eurozone Marriage turned Orgy and a Latin American Divorce!
Ahead of the Herd - Ignorance Is A Temporary Condition
VIDEO (13:50) : David Morgan SILVER Economic INTERVIEW @ ?Cambridge House?
ZeroHedge - "Material Banknote Order Reinstated"
Paper Money Collapse - Prozac-craving markets
VIDEO (13:00) : Keiser Report Paper Money Collapse
SafeHaven - Strong-Dollar Fallacy
321 gold - What is Money?
Mish's Blog - Key Words of the Day: "Nothing", "Fiscal Cliff", "Later"; Bernanke Speech Template; U.S. Fiscal Cliff and What to Do About It
06/07/12 - Bullion News
VIDEO (28:03) : Capital Account - Mike Maloney on Gold's Checkmate and Ben Bernanke's role as the Pawn!
Contrary Investing - Ray Dalio: US Has Done a “Beautiful” Job De-leveraging
SafeHaven - Gold and Silver Update - Looking Ahead
VIDEO (23:58) : Casey Research - James Rickards: The US Is the Biggest Currency Manipulator
The Real Asset - Gold bullion versus silver bars
Seeking Alpha - Jim Rogers: Buy Commodities Now, Or You'll Hate Yourself Later
GoldSeek - Does Any Clear Picture Emerge From Gold And Crude Oil Charts?
VIDEO (12:25) : CNBC - Bernanke's view of the U.S. Ecomony
Total Investor - Inflation WARNING: A surprising country could be on the verge of a "stealth" default
Dollar Collapse - Central Banks Dither Today, Panic Tomorrow
Bullion Street - Silver nano-particles can check minute water contamination
Azizonomics - The World Before Central Banking
American Thinker - A Balanced Approach: Tax like Bush, Spend like Clinton
Commodity Online - The Silver Institute adds four new members to its roster
06/06/12 - Bullion News
VIDEO (04:06) : CNBC - Chief Economist at Degussa Goldhandel - Thorsten Polleit; A Depression Is an Inevitable Outcome
Perth Mint Bullion - Interesting Sales Trend Emerges - What’s Your View?
The Real Asset - “Monetary Easing” fixes nothing
Mish's Blog - Merkel Bends, Equity Markets and Precious Metals Cheer, Bond Market Yawns; Lending to Peter so Peter Can Lend to Paul
Seeking Alpha - The Case For The Dollar: Nothing Has Changed
Ludwig von Mises Institute - The Danger of External Debts
Total Investor - BOB CHAPMAN PASSES AWAY JUNE 4, 2012
Bloomberg - Fed Presidents Clash Over Need to Provide More Stimulus
Merk Funds - What’s next for the U.S. Dollar? QE3?
AUDIO (53:00) : Stansberry Radio - Biggest Beneficiary of QE3: Gold
GoldSeek - In a Gold Standard, How Are Interest Rates Set?
06/05/12 - Bullion News
Whiskey and Gunpowder - 70's, 80's, 90's and Today's Gold Market
VIDEO (09:34) : Have we just seen the SILVER bottom? (David Morgan/Butler On Business)
VIDEO (25:46) : Max Keiser - Keiser Report: Paper Money Collapse
Money Morning - The Banking Plan That Could Be A Game-Changer for Gold
Numismaster - Bullion Demand Soars; Avoid Bars
Real Clear Politics - Playing With Words by Thomas Sowell
TF Metals Report - Dot Connecting
The Jerusalem Post - Archeologists uncover 2,000-year-old coins, jewelry
Silver Doctors - WSJ Takes Gold Bashing to Unseen Heights- Calls Gold ‘TOXIC’
The Telegraph - Spain makes plea for EU aid for troubled banks
ZeroHedge - Iran Gold Imports Surge - 1.2 Billion USD Of Precious Metals From Turkey in April Alone
Winnipeg Free Press - Royal Canadian Mint builds major addition
VIDEO (12:46) : Bill Murphy - Gold Anti-Trust Action Committee (GATA) - Cambridge House Live
Casey Research - The Table Is Set for a Mania
06/04/12 - Bullion News
VIDEO (03:24) : Fox Business - Schiff; "The Dollar will be the Facebook of SafeHavens"
Silver Coins Today - American Silver Eagle and 5 Oz Bullion Coin Sales Surge in May 2012
MoneyNews - Hussman: More Fed Easing Will Trigger Economic Disaster
Financial Post - Sprott: ‘Perfect environment for gold’
azizonomics - Debt is Not Wealth
VIDEO (23:34) : Future Money Trends - David Morgan Interview
CoinWeek - An Old-Fashioned Way To Invest In Silver
VIDEO(s) : Political Metals - From Canada to NZ, and everywhere in between, people are waking up!
06/03/12 - Bullion News
VIDEO (14:10) : Future Money Trends - John Williams of ShadowStats.com Interview
PDF : Gresham's Law - Deconstructing Stocks & The Mathematical Case for Contrarianism – (Sample Newsletter)
Mish's Blog - Wells Fargo Seizes Stockton California City Hall, Parking Garages; City Prepares Bankruptcy Contingency Plans; Bondholder Mediation Underway
Profit Confidential - Helping Thy Neighbor; Germany Demands Gold
Munknee - Your purchasing power as a median household went down in real terms by about 17%, from 2000 - 2010
NewsMax - Mikhailovich: Be Safe — Buy Physical Gold and Stash It
CNBC - Time Bomb? Banks Pressured to Buy Government Debt
06/02/12 - Bullion News
VIDEO (02:28) : Learn Liberty - Are Low Interest Rates Good?
Bloomberg - U.S. Mint’s American Eagle Gold-Coin Sales Double in May
POLL : Rasmussen Reports - 43% Are Very Worried Federal Government Will Run Out of Cash
VIDEO (25:45) : Max Keiser - Keiser Report: With Hugo Salinas Price
VIDEO (23:59) : Total Investor - Jim Rogers: Global Economic Shocks Coming in 2013-2014
ZeroHedge - US Debt Soars By $54 Billion Overnight, Closes May At Record $15,770,685,085,364.10
The Gold Report - The Ultimate Gold Bull Peter Grandich vs. The Muted Bear Steve Palmer
AUDIO (11:54) : FSN - David Morgan – Precious Metals Special Rally Report
06/01/12 - Bullion News
VIDEO (03:30) : CNBC - Santelli on Weak Jobs & the US Dollar
CoinWeek - The Coin Analyst: What Ever Happened to the New Golden Age of American Coin Design?
AUDIO (80:30) : Stansberry Radio Interviews Chris Martenson on Science & the Economy
Wall St. Cheat Sheet - David Einhorn Mocks Warren Buffett’s Stance on Gold
Smart Money - Behind the Gold Boom (excerpt from Michael J. Casey's book; The Unfair Trade: How Our Broken Global Financial System Destroys the Middle Class
VIDEO (25:09) : Capital Account - Mike Shedlock on the Spexit, the Grexit and Running for the Eurozone Exit!!
05/31/12 - Bullion News
Minyanville - Let's Get Physical: Top 10 Most Popular Gold Bullion Coins
VIDEO (08:11) : Silver Round Minting Process
CoinWeek - Modern U.S. Coin News Round-Up: New Releases from the U.S. Mint
AUDIO : Korelin Economics Report - James Turk discusses Gold
VIDEO (20:34) : Political Metals - Very Bullish Signals from the COT Report
POLL : Gallup - Americans Not Highly Focused on European Financial Crisis
VIDEO (19:54) : Casey Research - Greg Weldon: Turbulence Is Coming
Silver Coins Today – Sales Improve for US Mint Silver Coins
VIDEO (05:29) : Fox Business – Marc Faber on the Potential for a Market Crash in the Fall
ZeroHedge – Bill Gross: The Global Monetary System Is Reaching Its Breaking Point
05/30/12 - Bullion News
Hard Assets INVESTOR – Larry Baer's Technicals: Monthly Charts Don't Confirm Gold & Silver's Downtrends, Offering Opportunity
VIDEO (04:50) & Article : CBS This Morning – Major gold buyer cheating consumers?
AUDIO : MineWeb – Current gold price action counter-intuitive - Embry
The Gold Standard Now – Edgar Allen Poe's - The Gold Bug
Jesse's Café Américain – The Death of the Gold Bull May Be Greatly Exaggerated -- Miner / Bullion Ratio at an Extreme Low
CoinWeek – Dillon Gage Offering New, One-Ounce Johnson Matthey Silver Bars
Bullion Bulls Canada - The Three Trends Which Rule The Precious Metals Market, Part II
05/29/12 - Bullion News
CoinWeek - The Right Time to Buy Gold
VIDEO (28:07) : Capital Account - John Butler on the Dollar Liability and Gold's role as Insurance
Ludwig von Mises Institute - The Bernanke Bust
VIDEO (25:45) : Max Keiser - Keiser Report: Asymmetric Accounting
POLL : Rasmussen Reports - 38% View Federal Reserve Favorably, 49% Do Not
VIDEO (03:34) : CNBC - Santelli on MF Customers vs. JPM Shareholders
Financial Post - China’s ICBC has big dreams for bullion business
Bloomberg - Dollar Scarce as Top-Quality Assets Shrink 42%
CNBC - Yoshikami: Four Things You Need to Know About Gold Now
Perth Mint Blog - Sales of 2012 Kookaburra Coin With Dragon Privy Mark To Start 1 June
MineWeb - Platinum surplus diminishing as bear market approaches
Bullion Bulls Canada - The Three Trends Which Rule The Precious Metals Market, Part I
05/28/12 - Bullion News
Bullion Street - Haiti pins hopes on newly found Gold
VIDEO (07:43) : Future Money Trends - Interview with Jim Rogers
Max Keiser - Bad debt banks ‘should go bankrupt’ – Mr Keiser
Daily Reckoning - The Demise of the Cult of Equities
ZeroHedge - Gold Bar Demand in China Surged 51% to 213.9 Tons In 2011
Disciplined Investor - The Global Economic Read (Welllllll, we have trouble my friends…..)
AUDIO (42:27) : TF Metals Report - John Butler, author of "The Golden Revolution"
05/27/12 - Bullion News
SafeHaven - Are We to Blame Nixon?
Total Investor - A Gigantic Pennant forming on the Gold Chart...
CHARTS & ANALYSIS : Munknee - Deflation is Starting to Show Up; Can Hyperinflation Be Far Behind?
American Thinker - New Greek polls show bailout party in the lead
Summary & VIDEO (11:55) : Arabian Money - Will silver provide protection against the coming monetary inflation?
05/26/12 - Bullion News
VIDEO (36:40) : TIPS FROM DAVID MORGAN -- SILVER PRICES,MINING STOCKS, AND PRECIOUS METAL INVESTMENT
Dollar Collapse - Welcome to the Currency War, Part 1: Iceland and the Tragedy of the Commons
VIDEOs : Future Money Trends - Gold and Silver Update with Bill Murphy
Paper Money Collapse - Thoughts on the Greek crisis and the politicization of economics
VIDEO (26:22) : Irredeemable Currency Session vs Gold, Part 1/2
VIDEO (38:10) : Irredeemable Currency Session vs Gold, Part 2/2
AUDIO (45:55) : Stansberry Radio Interviews Jim Rogers (recorded 11/22/11)
SilverSeek - Illegalities by Ted Butler
05/25/12 - Bullion News
Daily Reckoning - Investing in Gold as World Economies Falter
CMI Gold & Silver - Another bullish technical indicator for silver?
VIDEO (06:58) : GoldSeek - James Rickards: Currency Wars – The Making of the next Global Crisis
VIDEO (04:01) : Yahoo (BreakOut) - Stimulus Is the Worst Option for Euro Zone: Schiff
Commodity Online - Shanghai Gold Exchange Silver volume hits 6 month high: UBS
Credit Writedowns - Chart of the Day: Euro Zone Government Debt
Contrary Investing - Platinum Chart Quite Foreboding for Global Economy
GATA - Wall Street Journal says Comex has been classified as 'too big to fail'
VIDEO (10:52) : CNBC - What's the 'Real' Deficit?
05/24/12 - Bullion News
Silver Doctors - CME Slashes Gold Margins 10%
VIDEO (03:27) : Before You Get The Clever Idea Of Leaving the Country With Your Physical Gold.....
Coin Update - 2012 America the Beautiful Five Ounce Silver Coins
AUDIO (14:08) : SILVER MARKET UPDATE - David Morgan
The Real Asset - The canary in the gold mine
Money Morning - Good News for Gold Prices: Commodities are Wounded, But Far From Dead
MineWeb - Gold - an investment for the long term. Ignore the bumps and peaks.
Azizonomics - Is China Really Liquidating Treasuries?
VIDEO (28:05) : Capital Account - The US Treasury prize, the Euro's demise, and Facebook lies w/Paul Craig Roberts
05/23/12 - Bullion News
The Gold Report - Will 'Peak Gold' Exploration Continue to Grow?: USGS' Micheal George
AUDIO : FSN - Interview with Peter Grandich; Check your emotions at the Golden Door
SilverSeek - Julian Phillips: Silver Price Falls with Euro; in hands of traders
Liberty Blitz Krieg - I’m Buying Silver
Market Watch - Why crash risk remains very real
Daily Mail - 'Money printing has not harmed pensions' claims Bank as it warns eurozone crisis could spark more QE
SafeHaven - Gold and Silver Are the Answer in the Long-Term
The Real Asset - Is the world ready for gold Turkey?
VIDEO (01:04) : Mike Maloney on fiat currencies
ZeroHedge - Will China Make the Yuan a Gold-Backed Currency?
SilverSeek - Hold on for eurobonds, JP Morgan and euro money printing to boost gold and silver prices
Seeking Alpha - Industrial Demand For Silver Declining
Paul Craig Roberts - Recovery or Collapse? Bet on Collapse
05/22/12 - Bullion News
VIDEO (12:38) : SGT Report - UNCLE SAM BULLYING BROKERS OVER SILVER? [Plus, JPM's $7 Billion Blunder] – Woody O’Brien
Investopedia - A Silver Primer
Daily Reckoning - Doug Casey on Taxes and Freedom, Part II
CoinWeek - Modern Coin News Round-Up: News from Major World Mints
AUDIO (18:53) : MineWeb - Silver a great business to be in for the next 50 years - Phil Baker
Real Clear Politics - Promises from Liars (commentary from Thomas Sowell)
MoneyNews - Commodities Broker Streible: Facebook Flop Is Good for Gold
Resource Investor - Swiss Parliament Examines ‘Gold Franc’ Currency Today
US Funds - Gold: The World’s Friend for 5,000 Years
VIDEO (01:18) : Peter Schiff on Gold
05/21/12 - Bullion News
Forbes - Herman Cain's Path To A 21st Century Gold Standard
VIDEO (02:45) : Liberty Blitz Krieg - Best SNL Parody of Wall Street…
The Gold Report - The People Have Spoken and Precious Metals Will Soar: Leonard Melman
VIDEO (12:43) : CoinWeek - The Jim Kingsland Show with an expert on Gold and Silver
MineWeb - Sprott sees great things for gold and silver
Mish's Blog - Full-Fledged European Bank Run; ECB Deposit Insurance is Not the Answer; How FDIC Played a Part in the US Real Estate Bust; Monetarist Fools are Everywhere; Believe in Gold
Rick Ackerman - At CMRE Dinner, Talk of a Looming Disaster
ZeroHedge - Why Has Gold Fallen In Price And What Is The Outlook?
Commodity Online - Bullish outlook for Gold on possibility of Eurozone breakup
SilverSeek - Poll: Is the Silver Price Manipulated?
SilverSeek - Poll Results: Where will Silver End 2012?
VIDEO (05:24) : CNBC - Gold Negatives Offset by Positives: Expert
05/20/12 - Bullion News
Coin News Today - Sales of US Silver Coins at 4-Month High as Silver Prices Hit 2012 Lows
AUDIO (48:07) : Chris Martenson interviews Alasdair Macleod: All Roads in Europe Lead to Gold
AUDIO (06:28) : FSN - Eric Sprott interview at Hard Asset New York
Mish's Blog - Apparel Sales by Price and Volume Provide Interesting Viewpoint; Apparel Inflation
VIDEO (09:17) : Future Money Trends - Silver Update with David Morgan
Jesse's Café Américain - Chris Powell Answers Doug Casey's Questions About Gold Manipulation
Ludwig von Mises Institute - How Should Prices Be Determined?
05/19/12 - Bullion News
AUDIO (13:12) : Alt Investors Hangout - Alasdair Macleod - "United States is already in a Debt Trap from which it cannot Escape"
The Gold Report - Shadow Stats - John Williams; The Recovery Is an Illusion
AUDIO (09:59) : Ellis Martin Report with David Morgan "Bottoms Up?"
AUDIO (29:49) : Silver Guru - David Morgan explains "What the Heck is with Metals?"
Investment U - 2012 Gold Price Forecast: Where We Are and Where We’re Going
Business Insider - ROBERT REICH TO NEW COLLEGE GRADS: 'You're F*cked'
VIDEO (01:43) : CoinWeek - ANACS Intends to be Included on eBay
VIDEO (05:20) : CNBC - Marc Faber: Looming Global Catastrophe?
Seeking Alpha - The 1 Investment Everyone Should Own
05/18/12 - Bullion News
Daily Reckoning - The Physical Gold Market – From the Weak to the Strong
Financial Sense - Steve Forbes: The Only Way Out Is a Return to Free Markets and Capitalism
Bloomberg - Fed May Prefer Another Twist to Adding Assets
Perth Mint Bullion - World Gold Council: Gold Demand Trends First Quarter 2012
Paper Money Collapse - By abandoning the gold standard we embraced monetary central planning, chaos
VIDEO (04:38) : CNBC - Marc Faber: Correction Could Be Something More Serious
TECHNICAL ANALYSIS : GoldScents - MAJOR LONG-TERM BOTTOMS FORMING IN GOLD AND COMMODITIES
MoneyWeek - Gold is near a critical turning point – where will it go next?
GoldSeek - Whales in the gold market
Inside Futures - The Daily Gold Report
The Daily Caller - Senate confirms two pro-bailout governors to Fed board
Bullion Bulls Canada - Central Bank Gold-Buying Increases by 500%
CMI Gold & Silver - There is no free market in gold
05/17/12 - Bullion News
VIDEO (25:46) : Keiser Report - Max talks to Mike Maloney about gold, silver and Hollywood accounting
Fast Markets - Precious metals bounce on QE3 speculation
Liberty Blitz Krieg - Herman Cain Backs the Gold Standard? – Op Ed
CHARTS : Gold Made Simple - With the gold price now flat for 2012 – time to compare this sell-off with the 2008 vintage
Gold and Silver Blog - Are Gold And Silver Bullion Sales Reported To The IRS? Tips For Keeping Bullion Sales Private
Commodities Now - CPM Group Releases Silver Yearbook 2012
Perth Mint Bullion - One Million Mintage For 2013 Kookaburra Silver Bullion Coin
Commodity Online - US Silver production declines sharply in Feb: USGS
VIDEO (15:00) : David Morgan's SILVER PRESENTATION at The Las Vegas MoneyShow
VIDEO (15:00) : Bill Murphy of GATA @ Las Vegas MoneyShow
VIDEO (12:45) : SGT Report - The JP Morgan Derivatives Book is Blowing Up - Bix Weir
ZeroHedge - Chris Martenson: "We Are About To Have Another 2008-Style Crisis"
VIDEO (28:03) : Capital Account - Jim Rickards on Europe's Bank Run and why JP Morgan was late to "Puke the Trade"
VIDEO (26:08) : Casey Research - Lacy Hunt: Curing Debt with Debt – Bad Things Will Happen
05/16/12 - Bullion News
Liberty Blitz Krieg - Silver Plunges Below Marginal Cost: Commentary from a Retired Geologist
Rolling Stone - Documents Show How Banks Screw Investors through 'Naked Short Selling'
Gold Investing News - Bear Market or Bull Opportunity?
VIDEO (06:44) : 12-Year Old Girl Reveals One of the Best Kept Secrets in the World
Resource Investor - ‘Crowded’ Gold Trade Needs to Lose ‘Weak Hands’ Investors
Market Watch - Gold drops ahead of Greek meetings
Article & VIDEO (09:42) : MoneyNews - Wiedemer: Fed to Print More Money If Stock Market Drops 15%-20%
SilverSeek - Gold and silver still the best protection against the derivatives blow up that started with JP Morgan’s loss
AUDIO : Korelin Economics Report - Big Al, Carter and Peter Grandich from the New York Hard Assets Conference
Express & Star - Roman coins haul dug up
Munknee - ALL There Is to Know About Gold Is HERE!
05/15/12 - Bullion News
CoinNews - Gold, Silver Prices Dip while US Bullion Coins Notch Gains
Dollar Collapse - Another Signpost On The Road To Inflation
PDF : US Funds - GoldWatcher - $2,400/oz?, $5,479/oz?, $46,000/oz? by Frank Holmes
VIDEO (10:31) : CNBC - Jim Rogers on JPMorgan, the Dollar & More
AUDIO : Korelin Economics Report - Rick Rule explains gold’s latest trend and the European variables
The Globe and Mail - Buy bullion, not gold stocks: top hedge fund manager
Business Insider - It Would Appear That The European Economy Is Going To Get Worse
Jim Sinclair's MindSet - Your Greatest Enemy Is Your Emotions
05/14/12 - Bullion News
Gresham's Law - Is Gold a Good Investment?
AUDIO : FSN - LEGENDARY INVESTOR - Jim Rogers says to Follow Your Passion
Money Control - Gold, Silver may trade lower on strength in US dollar
AUDIO (13:51) : MineWeb - Platinum, palladium market trends 2012 - Johnson Matthey
Silver Vigilante - For Silver, The New World Order is the Old World Order
Rick Ackerman - Buy Gold Below $3000? ‘You Can’t Lose’
VIDEO (02:47) : HyperReport - Home Safes Show Mistrust of Banks
Political Metals - JP Morgan Chase for Dummies
VIDEO (44:54) : Interview with the Golden Jackass - Jim Willie - on the TF Metals Report
05/12/12 - Bullion News
Elliot Wave - Gold and Silver: Hedges Against a Financial Downturn? - You might be surprised by the answer
Ahead of the Herd - Money Slow Down
The Gold Report - Gold Is Not a Growth Industry—It Can Just Pay Investors Big: John Hathaway
Casey Research - Quest for Confidence
AUDIO (03:23) : BBC Radio; Investor Jim Rogers tells it like it is...
05/11/12 - Bullion News
CoinWeek - The Coin Analyst: The Euro Crisis, Currency Wars, and the Outlook for Precious Metals
AUDIO (24:04) : Trading Talk Interviews David Morgan from The Morgan Report
Rick Ackerman - What We Really Think About Gold
SilverSeek - The Power of Relative Value & the Silver Market! WOW!
Commodity Online - Chinese Copper production declines in April as consumption remains weak
Money Morning - Everything You Need to Know About Gold Prices
VIDEO (05:10) : CNBC - Precious Metals Still Shining?
American Thinker - In Search of the Dreaded Austerity
Daily Reckoning - Funny Money From The Feds
Index Universe - Merk Gold ETF To Be Redeemable In Bullion
Summary & VIDEO (07:12) : ZeroHedge - To Jim Grant The World Of Finance Is Nothing But The "Truman Show"
US Funds - Gold Takes It On the Chin…What’s Next?
05/10/12 - Bullion News
TECHNICAL ANALYSIS : SafeHaven - Gold Questioning Fed's Effectiveness
VIDEO (03:54) : Whiskey and Gunpowder - How Much Is Your Coin Worth?
Paper Money Collapse - Europe’s voters say ‘No’ to economic reality
CMI Gold and Silver (Bill's Blog) - Gold: a problem of perception
VIDEO (09:23) : Casey Research - John Hathaway Calls a Market Bottom
Silver Coins Today - Sales of America the Beautiful 5 Ounce Silver Coins Fairly Steady
SilverSeek - Knowing the Game by Ted Butler
The Real Asset - Is gold in your permanent portfolio?
VIDEO (07:40): CNBC - Gold Safe-Haven or Risk Asset?
VIDEO (27:53) Capital Account - Nigel Farage on the "EU Titanic" and the "Rebirth of National Socialism in Europe"
05/09/12 - Bullion News
arabian money - Watch for QE3 as the bottom to this drop in oil, gold, silver and stocks
VIDEO (15:49) : Steve Forbes interviews Jim Rogers: Don't Give Up On The U.S.
Profit Confidential - Another Key Stock Market Indicator Flashes Red
MoneyWeek - Why a Greek exit could be great news for markets
Rolling Stone - Austerity Can't Be Just for Regular People
Bloomberg - When Entrepreneurs Privatized the Penny
Coin Update - US Mint Sales: Silver Numismatic Products Slower
Perth Mint Bullion Blog - Gold Demand Not Broad Based
AUDIO : The Korelin Economics Report - Al Korelin Interviews Retail Gold Investor
MoneyNews - Fed’s Fisher: More Monetary Easing Won’t Fix Economy
GoldSeek - Gold Cover Clause Guidance
Political Metals - Can you spot the Bubble(s)?
Money Guru India - Gold to be bought into at every sell-off points; Gold still remains favorable as an effective portfolio diversifier
VIDEO (04:26) : Trims Tabs - Sell in May and Go Away for Third Straight Year
05/08/12 - Bullion News
The Gold Report - The End of the Debt Supercycle Draws Near: John Mauldin
Deseret News - Gold frenzy: Is Glenn Beck's favorite metal a good investment? Rush for precious metal shines, dims on investors
VIDEO 04:52) : Yahoo (BreakOut) - Buffett Is Wrong, Gold Prices Will Soar as European Austerity Dies
SafeHaven - Gold and Financial Preparedness
GoldScents - GOLD IS AT, OR VERY NEAR A LONG TERM BOTTOM
VIDEO (12:50) : The Gold Standard - Interview with Jim Rogers
arabian money - Why do investors always take such a short-term view on gold?
Bloomberg - China’s Gold Imports Jump as Country May Become Biggest User
VIDEO (02:48) : Learn Liberty - Are Corporations People?
VIDEO (06:20) : CNBC - Commodities to Move Sideways this Year
05/07/12 - Bullion News
PDF : Royal Canadian Mint - 2011 Annual Report – "From Main Street to Bay Street and Beyond"
Commodity Online - Demand for Gold ETF’s falling, not Gold bullion: Michael Lombardi
Article & VIDEO (05:37) : ZeroHedge - Do What Buffett Says, Not What He Does
VIDEO (28:02) : Capital Account - Matina Stevis on Greek Elections, the Golden Dawn, and the End of an Era
CMI Gold & Silver (Bill's Blog) - Why is gold getting hammered?
MineWeb - All the gold and silver roads now leading to China
ZeroHedge - India Folds On Gold Excise Tax: Indian Gold Restocking Imminent
Money Morning - The Commodities Bull Market: Insights on Gold, Energy and Agriculture (Interview with Rick Rule of Sprott Global Companies)
Gold Eagle - Update For The Silver To Gold Ratio
VIDEO (15:41) : James Grant with Bloomberg on Fed Bailout
Azizonomics - The Treasury Bubble in One Graph
The Street - 10 Forces Conspiring Against Your Savings
05/06/12 - Bullion News
SafeHaven - The Dollar and Gold Have Eyes on Europe
Daily Mail - The curse of Brink's Mat: UK's largest bullion heist
StarTribune - Sale, theft of customer lists fuel coin fraud
Gold Money Report - From Government to ‘Robberment’
Reuters - India's FMC hikes position limits in gold contracts
05/05/12 - Bullion News
The Gold Report - The Emperor is Naked: David Stockman
VIDEO (38:49) : Alasdair Macleod: Why The Europe Situation is Certain to Get Worse
Arabian Money - Black Monday for global financial markets?
IBTimes - Palladium Supply Worldwide To Remain In Deficit This Year: Survey
Metal Miner - Precious Metals Update: US Platinum Bars Still Down
Wealth Daily - "Individuality, liberty and property: This is man."
Guelph Mercury - Mineral collector loves “thrill of the chase” at old silver mine properties
ZeroHedge - Dr. Lacy Hunt On Debt Disequilibrium, Deleveraging, And Depression
05/04/12 - Bullion News
AUDIO (13:53) : FSN - David Morgan - The Silver Suppression scheme is Ending
CoinWeek - Former Central Banker Confirms US Government Gold Price Suppression Efforts
Casey Research - Is an Ounce of Gold Worth $10,000?
INO - Poll: Is Gold the best investment?
MoneyWeek - What’s the point of gold?
The Real Asset - Keynes, the closet gold bug
VIDEO(s) (30:48) : Future Money Trends - Mike Krieger Interview - A White Knight for the Liberty Movement
Commodity Online - Rising resource nationalism is bullish for Gold: HSBC
VIDEO (12:30) : Part II: Gold Standard in Next 5 Years, China First - John Butler's "The Golden Revolution"
Rick Ackerman - A Wickedly Bumpy Ride for Gold Bulls
Summary & VIDEO (11:02) : Modern Day Prospector finds Gold Pocket
05/03/12 - Bullion News
Summary & VIDEO (09:34) : ZeroHedge - Jim Grant: "The Federal Reserve Is The Vampire Squid Of Vampire Squids"
Smart Money - More Americans Stashing Cash in Home Safes
SafeHaven - Central Bank Demand to Change Gold, Silver Markets and Prices
Fast Markets - Precious metals slide further ahead of ECB rate decision
MoneyNews - Faber: Gold Prices Aren’t a Bubble
Seeking Alpha - Gold Stocks Will Continue To Under-perform Gold Bullion
Perth Mint Bullion Blog - Demand for 2011 Koala Coin Sets Record
Minyanville - Guess Who's Gold's Best Friend?
VIDEO (04:44) : Jim Rogers The Next Economic Slowdown Is Going To Be Much Worse
CoinNews - American Eagle Silver, Gold Bullion Coin Sales Slide in April
AUDIO (14:05) : MineWeb - Jeff Nichols, looks at why central bank buying is so important and the potential impact of a breakup of the euro zone on the gold market
ZeroHedge - Swiss Gold Stored At “Decentralised Locations” – SNB Does Not Disclose Where
VIDEO (04:35) : Learn Liberty - Social Security vs. Private Retirement
iol - Other ways to go for gold
05/02/12 - Bullion News
DOCUMENTARY : VIDEO : FRONTLINE - MONEY, POWER & WALLSTREET - Part II [Episode III (57:25) & Episode IV (56:20)]
CHARTs : TECHNICAL ANALYSIS : GoldScents - THE INFLATION TRADE IS ON: BERNANKE HAS BROKEN THE DOLLAR RALLY
Business Insider - Gold and Silver Monthly Outlook for May
The International News (Blog) - Is Capialism the Culprit?
MineWeb - Patterns in gold price puzzling - but understandable
VIDEO (28:05) : Capital Account - Mike Shedlock tackles Paul Krugman and the Greenspan Contrarian Indicator (GCI)
American Thinker - The Real Cost of a College Education
VIDEO (05:00) : CNBC - Peter Schiff; The US Is Coming Off Stimulus Induced High
Coin Update - Online Coin Buyers Should Read Terms of Service
Daily Reckoning - Time to Accumulate Gold and Silver
ZeroHedge - Total US Debt Soars To 101.5% Of GDP
Summary & VIDEO (15:05) : USA Watchdog - Charles Biderman: EU Debt Crisis Going to Get Worse
Daily Wealth - I'll Refer to This Book for the Rest of My Life
Silver Doctors - Barron’s Releases Massive Silver Propaganda Hit Piece
CoinNews - US Mint Commemorative, Gold Coins Poised for Price Increases
VIDEO (04:25) : Fox Business - Government Debt Growing Twice As Fast as Economy
05/01/12 - Bullion News
Mish's Blog - I'm Swapping Some Gold for Silver
Business Insider - Details Of This Morning's Massive $1.24 Billion 'Gold Finger' Trade
VIDEO (22:56) : Ron Paul vs. Paul Krugman on The Fed & interview Bloomberg TV
Seeking Alpha - Is George Soros Wrong About Gold?
Commodity Online - David Morgan: Silver, the single greatest investment in past 100 years
VIDEO (28:05) : GATA's Bill Murphy exposes how the Gold Cartel is Bombing the Market for Precious Metals
Wall Street Journal - A ‘Gold’ Finger Behind Bullion’s Morning Tumble?
Gold and Silver Blog - Gold And Silver Bullion Coin Sales Plunge In April – What Is John Q Public Thinking?
VIDEO 02:33) : Business Insider - JIM ROGERS: The One Thing Investors Need To Consider Before Diving Into Commodities
Investment Rarities - Wipe Out! by Jim Cook
Article & VIDEO (12:38) : CNBC - Two Fed Presidents Differ on Need for More Stimulus
VIDEO (04:45) : TrimTabs - Biderman’s Daily Edge: QE to Infinity and Beyond!
CoinWeek - Where Bullion Investing And Coin Collecting Merge – PART 2
04/30/12 - Bullion News
CHARTS : TECHNICAL ANALYSIS : Inside Futures - Silver - A Question Of When
SilverSeek - Critical Factors that will Impact Silver
Bloomberg - Gold May Decline on Concerns About Physical Purchases
Seeking Alpha - Gold 'Buying Opportunity' - Gold Analysts More Bullish On Central Bank Demand
Acting Man - Growth versus Austerity – A Phony Debate
Metal Miner - Copper: A Disconnect on What the Future Holds
Arabian Money - Investors dumped equities in April fastest in 17 years, will they now turn to gold and silver?
MoneyNews - Yale’s Shiller: World in a 'Late Great Depression'
Pragmatic Capitalist - RETAIL SALES, PMI REPORTS SHOW WEAKENING EUROZONE ECONOMIES
Business Insider - GOLDMAN: The Economy Is Slowing, And This Weeks Jobs Report Will Be Worse Than What People Expect
04/29/12 - Bullion News
NZ Herald - Eurozone woes keep everyone guessing over gold (New Zealand Mint has New Owner)
arizonomics - Gold’s Value Today
Wealth Daily - Gold: The Bargain of a Lifetime
VIDEO(s) (21:68) : Future Money Trends - Interview with Marc Faber
NZ Herald - Eurozone woes keep everyone guessing over gold (New Zealand Mint has New Owner)
arizonomics - Gold’s Value Today
Wealth Daily - Gold: The Bargain of a Lifetime
Money Morning - How "Nano Gold" Could Revolutionize Biotech
Wealth Wire - 9 Implications of China Paying in Gold
MoneyNews - Inflation: The Slow, Inexorable Erosion of the Dollar’s Buying Power
4/28/12 - Bullion News
CoinNews - Gold Gains 1.3% on Week but Silver Sheds 0.8%, Eagle Coins Struggle
VIDEO (58:29) : Chris Martenson Interview's Bill Black: Our System is So Flawed That Fraud is Mathematically Guaranteed
Ahead of the Herd - A Return To Real Money
VIDEO (23:27) : Max Keiser - On the Edge with Zeus Yiamouyiannis
Futures Magazine - Q & A : Jim Sinclair has something to say
Financial Sense - Topping Dollar: Good News for Commodities Now, Bad News for Economy Later
04/27/12 - Bullion News
Silver Doctors - JP Morgan Increases Registered Silver Inventories 500% OVERNIGHT
CoinWeek - The Coin Analyst: There’s More to Gold’s Future Than Quantitative Easing
Article & VIDEO (03:58) : Market Watch - Gold gains on weaker dollar, euro-zone fears
BBC - Bullion theft plan admitted by four men from Essex
Article & VIDEO (43:36) : Gold Made Simple - The gold meme continues – this time courtesy of Ron Paul
VIDEO (13:17) : David Morgan joins Ellis Martin for an impromptu discussion on the boondoggling being done to the American public visa vi obese congressional bills
Wall St. Cheat Sheet - Gold & Silver: Ben Bernanke Overshadows FOMC Minutes
CoinNews - 2012 American Silver Eagle San Francisco Two-Coin Proof Set
Rick Ackerman - What Gold Lacks Is Short-Covering Panics
BusinessWeek - Gold Traders Get More Bullish as Central Banks Hoard More
Paper Money Collapse - The separation of money and state
VIDEO (04:27) : Yahoo (BreakOut) - The Federal Reserve QE Debate
Daily Reckoning - US Bonds – An IOU From the World’s Biggest Debtor by Bill Bonner
courant - Who Pays More For Your Gold, A Pawn Shop Or Jewelry Store?
04/26/12 - Bullion News
VIDEO (28:04) : Capital Account - Jim Grant explains how Central Banks are Waging War on Supply and Demand
China Daily - The Shanghai Futures Exchange received regulatory approval on Wednesday to start trading in silver contracts
Business Insider - BILL GROSS: I Don't See QE Happening At This Point
DOCUMENTARY : VIDEO : FRONTLINE - MONEY, POWER & WALLSTREET - Part I [Episode I (59:10) & Episode II (54:30)]
Ahead of the Herd - Nixon, Gold and Oil
MoneyControl - Expect Gold, Silver prices to trade higher today: Angel
VIDEO (06:35) : Jim Rogers on Markets, Economy and China
Financial Sense - Charles Biderman of TrimTabs: Ignorance is Bliss Regarding Government Economic Data
MoneyWeek - Could the gold standard be making a comeback?
MoneyNews - Rogers: Loose Fed Policy Is Bad for US Economy
AUDIO : FSN - Trace Mayer; becoming an invisible man could save your wealth
USA Watchdog - Gold Will Win Money War
VIDEO (08:44) : TrimTabs: A Conversation with Chris Martenson
VIDEO (02:48) : Learn Liberty - Does Government Have a Revenue or Spending Problem?
IBTimes - Palladium Bounces On Demand For Industrial Metals Exposure
Metal Miner - Selling the Family Silver: How Melters, Smelters Profit From Antiques
SHFTplan - 22 Red Flags That Indicate That Very Serious Doom Is Coming For Global Financial Markets
04/25/12 - Bullion News
Ludwig Von Mises Institute - Not Enough Inflation?
Article & VIDEO (03:15) : Wealth Wire - Space Mining: The Gold Rush of the Future?
Jesse's Café Américain - Tavakoli: Another Financial Crisis Looming, And You're On Your Own
Article & VIDEO (19:40) : USA Watchdog - Tony Robbins’ Dire Wake-Up Warning
Gold Scents - GOLD'S B-WAVE BOTTOM
The Gold Report - Indicators Predict Gold Trend to Continue: John LaForge
321gold - Is gold still cheap?
Hard Assets INVESTOR - Precious Metals Monitor: Russia & Mexico Buy More Gold, Central Banks Now Hold 1 Billion Ozs.
American Thinker - Is the austerity consensus falling apart in Europe?
MineWeb - Investors buying sovereign debt rather than gold
04/24/12 - Bullion News
VIDEO (28:02) : Capital Account - GoldMoney's James Turk gives his timeline on the Dollar's Collapse and Gold's role as the messenger!
CoinWeek - WHERE BULLION INVESTING AND COIN COLLECTING MERGE – PART 1
Minyanville - The Silver Reverse Bubble of 2012
VIDEO (06:28) & Article : Mish's Blog - Marc Faber Discusses Imminent Market Crash, a Recession in China, Says Fiscal Condition of US a "Catastrophe"
CMI Gold & Silver - $46 silver on its way?
moneynews - Gundlach: Fed Can’t 'Pre-emptively' Hike Rates on Inflation
Perth Mint Bullion Blog - India Splurges On Gold
MineWeb - Twelve countries increase their gold reserves in March - some significantly
Article & VIDEO (04:29) : Wealth Wire - Sound Money Takes Hold in Utah, Missouri and South Carolina
04/23/12 - Bullion News
CoinNews - Gold Prices Drop to 2-Week Low, US Bullion Coin Sales Rebound
Forbes - The Best Reason in the World to Buy Gold
Fast Markets - Gold softens on weak euro, debt crisis woes resurface
Daily Wealth - Stop Worrying about Gold... We'll See New Highs Within 12 Months
ZeroHedge - The Exter Inverted Pyramid - A Refresher
Seeking Alpha - Gold: The Fate That Awaits Once Fed Stimulus Ends
Daily Reckoning - How Not to Fix A Debt Problem
VIDEO (01:58) : Fox News - Gold rush: California's weekend warriors discover prospecting
Bloomberg - Bullish, Bearish Forecasters Agree on Strong Dollar
Resource Investor - This is What a Lost Decade Gets You
The Gold Report - How to Speculate Your Way to Success: Doug Casey
04/22/12 - Bullion News
Sydney Morning Herald - Gold: the asset that keeps defying the pundits
Summary & VIDEO(s) (29:18) : Future Money Trends - James Rickards on Central Banks Obsession with Gold and Why more QE is Imminent! : Parts I & II
MineWeb - As investors lose faith in dollar gold will win out
VIDEO (23:09) : French economy & Presidential elections-On the Edge with Max Keiser Interview's Gonzalo Lira
Business Insider - MICHAEL PENTO: Decoupling Is An Illusion And Europe's Demise Will Crush Global Markets THIS SUMMER
Commodity Online - Gold/Platinum ratio points to higher Gold prices
04/21/12 - Bullion News
VIDEO (32:37) : Chris Martenson Interview's Harvey Organ: Get Physical Gold & Silver!
CoinNews - Gold Prices Fall on Week as Silver Gains, US Bullion Coin Sales Lower
VIDEO (07:53) : David Morgan "Myths in Silver" Interview California Resource Investment Conference 2012
CoinWeek - Gold “Needs to Reclaim $1700? for Renewed Buying
Paper Money Collapse - Why gold is my favorite asset
NewsChief - Coins may be valuable hidden treasures in your home
Article & VIDEO (76:46) : Zero Hedge - Money As Debt
AUDIO : FSN - Jeff Berwick getting your Gold out of Dodge
Yahoo Finance - Gold ETFs: Miners vs. Bullion
INFO-GRAPHIC(s) : ZeroHedge - Presenting The US Government’s Infographic Of Its Own Insolvency
04/20/12 - Bullion News
VIDEO (25:44) : Rolling Stone - Talking Gangster Banks with Max Keiser
Wall St. Cheat Sheet - Gold and Silver Miners Put Real Money Where Their Mouth Is
Bloomberg - Gold May Gain a Second Day as Weaker Dollar Spurs Demand
Gold Made Simple - First Deflation then Inflation, Phase One and Two
Wealth Wire - Chimps Throwing Poop and 29 Other Mind Blowing Ways That the Government is Wasting Your Money
Article & VIDEO (19:42) : CMI Gold and Silver Blog - QE, or not QE, that is the question
Numismaster - Opportunity Knocks in Gold Eagles
Max Keiser - The Wile E. Coyote Economy
SilverSeek - COMEX Reduces Silver Margins Yet Again
Hard Assets INVESTOR - Jim Rogers On When To Buy Gold, Chinese Bubbles And Fake Good News
VIDEO (28:05) : Capital Account - Are Central Bankers just Economic Make-up Artists, Sexing-up Prices?
04/19/12 - Bullion News
Seeking Alpha - A Historical Buying Opportunity In Silver
SafeHaven - Inflation and Hidden Gold Taxation: 3 Historical Case Studies
Silver Coins Today - 2012 Australian Koala Silver Coin Minted to 1/10 Ounce
ZeroHedge - The Risk Of 'Hot' Inflation
My Budget 360 - The Long-Term Debt Emergency has Arrived
Wealth Wire - Stocks Vs. Gold Vs. Real Estate
Metal Miner - US Palladium Bar Price Rises 4.4% for the Week; Platinum Falls
Investment Rarities - JPMORGANON TV by Ted Butler
AUDIO (16:12) : GoldSeek (Nuggets) - Interview with Silver Guru - Eric Sprott
04/18/12 - Bullion News
"See more at the link below this Video"
Across the Street - Elmo Tries to Explain The National Debt (Again)
VIDEO (07:27) : Market Watch - The Future of Gold and Money
Wall St. Cheat Sheet - Are Taxi Drivers Buying Gold or Apple?
CoinWeek - Major Gold And Silver Price Suppression Now A Weekly Occurrence. So What?
SafeHaven - Salvaging Your Savings
The Street - Cramer: Why Gold Remains Compelling
Reuters - Syria selling gold reserves as sanctions bite: sources
Rick Ackerman - Why the Global Banking System Is a Scam
AUDIO : Korelin Economics Report - Manipulation? You bet, says John Embry
AUDIO (10:40) : MineWeb - The likelihood of QE and a long-cycle correction for gold – Murenbeeld
04/17/12 - Bullion News
VIDEO (43:24) : Silver Guru; David Morgan UNCUT Lecture at the Texas Precious Metals Conference 3/16/2011
Chris Martenson - The Trouble with Money
Gold and Silver Blog - Gold/Platinum Ratio Suggests Much Higher Gold Prices Are Coming
VIDEO (04:10) : Yahoo (BreakOut) - Easy Money + Low Rates = Gold at $2000 by Year End
American Thinker - Keynesian Economics is a Beach!
Commodity Online - Silver: The top performing Precious Metal since 2008
AUDIO (23:00) : Jim Rogers puts his money where his mouth is
321gold - Sprott Will Signal Silver Bottom
04/16/12 - Bullion News
Casey Research - Rick Rule: Why I'm Excited About This Market
Financial Sense - Physical vs. Paper: The Real War
AUDIO (31:32) : FSN - Rick Ackerman Thinks the Dollar is Heading to $90
CoinWeek - The Coin Analyst: What’s the Best Way to Invest in Silver?
PDF : drschoon - GOLD FIRE SALE
Resource Investor - Does Gold Investing Pay?
Ahead of the Herd - Of Debt, Gold and Okun's Law
CHARTS : Business Insider - AWESOME: Brand New Richard Koo Presentation On The Global Economic Crisis
VIDEO (02:00) : Peter Schiff: Ben Bernanke completely clueless!
iol - Scandal of underweight gold Krugerrands
SafeHaven - Sell Signals Across The Board
BusinessWeek - A History Lesson as Canada Tries to Digitize Coins
Business Insider - Ray Dalio's Bridgewater Says Spain Is Worse Off Than It Was Before The LTRO
Minyanville - Spain: Too Big to Fail and Too Big to Save
Numismaster - Gold Eagle Mintages Reduced
VIDEO (02:19) : CNBC - Santelli Exchange: Chain of Insolvency
04/15/12 - Bullion News
AUDIO (57:01) : Interview with Silver Guru David Morgan about today's Precious Metals Markets and more...
CoinNews -Gold Logs Weekly Increase as Silver Retreats, US Bullion Coins Improve
Business Line - What drives silver prices
Wall St. Cheat Sheet - Here’s How Inflation Affects YOU
VIDEO (19:16) : Brother JohnF - Silver Update 4/14/12 James Turk Interview
Dollar Vigilante - Getting Your Gold Out Of Dodge
The Real Asset - Titanic: The ship that sank the gold standard
VIDEO (28:04) : Capital Account - Shark-infested Equity Waters, Metals Manipulation and Energy Depletion; Lauren Lyster Interview's Chris Martension
GoldSeek - Bullish Gold Technicals
VIDEO (08:09) : Watch for SILVER to SPIKE low and buy...Interview w/ Silver Guru David Morgan
Daily Weatlh - The Sensible, Low-Stress Way to Own Gold and Silver
CHARTS & ANALYSIS : The Acting Man - Gold and HUI Revisited
04/13/12 - Bullion News
The Street - Morgan Stanley: Precious Metals Déjà Vu
Financial Sense - Golden Eye of Hurricane
Wealth Wire - 50 Surprising Facts You Never Knew About Gold
Reuters - Inflation outpaces earnings, threatens spending
VIDEO (04:26) : LearnLiberty - Does the Minimum Wage Hurt Workers?
SilverSeek - CME says to cut silver, copper, palladium margins
Whiskey and Gunpowder - Healthcare Solution: Go Back to Cash
The Telegraph & Argus - Hoard of Roman coins found in Dales
AUDIO : Korelin Economics Report - James Turk discusses gold with Big Al
04/12/12 - Bullion News
The Source (WSJ) - Gold Shines On
PDF : Pimco - The Great Escape; Delivering in a Delevering World
AUDIO : Korelin Economics Report - Frank Holmes discusses gold
ETF Daily - We Are Not In An Economic Recovery; We Are In A Weak-Dollar-Fueled Market Rally
Summary & VIDEO (03:29) : ZeroHedge - Biderman Short Of Euros In Gold Terms
AUDIO : FSN - Ed Steer's looking Forward to a Golden Retirement
Resource Investor - IMF: Bullion is a Scarce ‘Safe Asset’
The Real Asset - Vietnam goes nuclear on gold
Wealth Daily - The Cost of Debt
Market Watch - China buying gold?
Moneynews - Jim Chanos: I'm Shorting Chinese Banks
VIDEO (28:01) : Capital Account - Lauren Lyster Interview's Lew Rockwell; A Look at where Central Banks are Steering Society
04/11/12 - Bullion News
Moneycontrol - Why you should buy your wife a silver spoon than a gold bar
VIDEO (03:22) : 5min - Bullion Investor iPad App Review
AUDIO (10:06) : MineWeb - Short term, silver's risks are to the downside - David Jollie; Mitsui and Co. Precious Metals strategist
SLIDESHOW : Bloomberg - Most & Least Taxing States 2012
INFO-GRAPHIC : Trustable Gold - Vaulted Gold – Facts and Figures
AUDIO : Korelin Econmomics Report - Simon Mikhailovich discusses “safe haven trades” and “safe havens”
VIDEO (08:02) : In Gold We Trust?
IndyStar - Masked man ties up woman, steals $90K in gold, coins from Southwestside dealer
Real Clear Politics - Random Thoughts by Thomas Sowell
321gold - The Key to Reading the Gold Bull
Bloomberg - Gold May Fall as Some Investors Sell Amid Europe Concerns
Business Insider - Are Market Events A Cover For Silver Manipulation?
VIDEO (04:41) : Yahoo (Break Out) - Ease Up on Stocks, Gradually Accumulate Gold: Marc Faber
04/10/12 - Bullion News
Market Watch - Gold’s sentiment foundation bullish
Mish's Blog - Lollipops and Tantrums
Investment U - Graded Coins
VIDEO (25:45) : Max Keiser - Keiser Report: Return of the Silver Liberation Army
VIDEO (03:55) : Silver Guru - David Morgan - Silver, Gold, Platinum, Electronics & Bulk Seeking Alpha - Silver Bullion: The Most Affordable Way To Protect Your Wealth
Merk Funds - Recovery – Who are We Kidding?
MineWeb - For gold to rise physical buyers must return
MoneyNews - Hussman: Bernanke Creating ‘Bubble’ to Make Americans Feel Better
Minyanville - The Dollar Index Winning by Default
The Golden Truth - More on Housing, Gold, Etc...
Article & VIDEO (14:05) : USA Watchdog - Confiscation of Gold and Silver Coins Will Not Happen
VIDEO (03:37) : Yahoo (BreakOut) - Fed Needs a Sympathy Sell-Off Before Doing QE3: Marc Faber
Commodity Online - Silver prices set to remain volatile: Barclays
Summary & VIDEO (24:31) : Future Money Trends - An Alternative to Protecting Yourself from Inflation
Oregon Live - Thieves steal $75,000 in gold, silver coins from home near Kelso
US Funds - Managing Expectations: Why Gold Should Thrive by Frank Holmes
The Real Asset - A case of cult envy
AUDIO : FSN - GATA’s Bill Murphy Sees Non-Stop Government Gold/Silver Manipulation
04/09/12 - Bullion News
CHARTS & ANALYSIS : Resource Investor - Gold & Silver Look to US Dollar, QE3 Outlook
Reuters - Gold firms on China inflation spike, U.S. jobs data
ETF Daily News - Silver Price Manipulation: Ted Butler On What’s Really Going On With Silver
Article & VIDEO (05:00) : Trading Nrg - Gold and Silver Prices Weekly Outlook for April 9-13
VIDEO (08:56) : Jim Sinclair - interviewed by Lars Schall
Weekly Standard - $73,000 Debt Per American Under President's Budget Plan
TECHNICAL ANALYSIS : Munknee - Gold and Gold Stocks Going Even Lower! Here’s Why
arabian money - Gold sometimes rises and sometimes falls in a recession don’t risk being out of this market
DNA - The age of gold is not over
ZeroHedge - 150 Years Of US Fiat
Silver Doctors - If gold isn’t money, why did Vietnam just outlaw using it as such?
Whiskey and Gunpowder - The Market That Really Matters
AZ Central - IRAs are wise investments; what to know
04/07/12 - Bullion News
VIDEO (28:00) : Capital Account - Lauren Lyster Interview's Mike Maloney; He breaks down Price Manipulation in the Gold and Silver Market
The Daily Caller - Federal Reserve, SEC balk at FOIA requests
Silver Vigilante - Reuters Bamboozles the public, dedicates hit piece to silver
GoldScents - STOCKS HAVE REACHED THE EUPHORIA STAGE
VIDEO (23:01) : Max Keiser - Max Interview's Dan Collins about China's Economic Outlook
Financial Sense - Silver’s Trend & the Death of Technical Analysis
AUDIO (15:27) : FSN - Bix Weir – European Derivatives Are Blowing Up and The JP Morgan Rogue Trader Cover Story
The New York Times - Penny Wise, or 2.4 Cents Foolish?
Commodity Online - India jeweller strike ends but gold imports not to rise as inventory piles up
04/06/12 - Bullion News
Summary & VIDEO (05:47) : ZeroHedge - What Is Capitalism?
AUDIO : Koreline Economics Report - Big Al and Rick Ackerman discuss economics and precious metals
Rick Ackerman - With Gold Prices Falling, We’ll Take the Odds
The Real Asset - Killing the golden goose that lays the golden egg
The Hindu - Jewellers suspend strike after meeting Pranab
Business Insider - FROM PARTICLES TO BULLION: The Complete Story Of How Gold Is Mined And Refined
321gold - Don't Catch Recovery Fever by Peter Schiff
Commodity Online - Palladium to outpeform Gold, Silver, Platinium in medium term
Moneynews - Gold Edges Up as Dull US Jobs Data Revive Easing Talk
Mish's Blog - Nonfarm Payroll +120,000, Unemployment Rate Fell .1 to 8.2%, Record 87,897,000 "Not in Labor Force"
Future Money Trends - Central Planning for Dummies: There Will Be QE
The Globe and Mail - Three commodities with promise
Click on Detroit - Birmingham police investigating jewelry theft
GoldSeek - Groundhog Day
04/05/12 - Bullion News
Perth Mint Bullion Blog - The Perth Mint will announce total ounces of gold and silver it sells every month as minted products
MineWeb - U.S. Mint sees uneven gold and silver coin sales as prices fluctuate
VIDEO (25:46) : Max Keiser - Keiser Report: Angel Dust for Ponzi-Addicts
GoldSeek - Jim Rogers “I Will Buy More” Gold – Still Long Term Bullish
The Daily Caller - An impossible 57% of Spain’s budget is devoted to pensions, unemployment benefits and interest
VIDEO (24:26) : Chris Martenson Interview's Mike "Mish" Shedlock
Summary & VIDEO (13:53) : arabian money - Silver bugs point out that silver prices should have fallen far further on the recent sell-off
Wealth Wire - Silver's Trend and the Death of Technical Analysis
VIDEO (03:17) : Learn Liberty - Why Not Print More Money?
AUDIO (11:17) : FSN - David Morgan Says No QE3 For You
AUDIO (04:17) : FSN - Peter Grandich – We Told You So – Gold and Silver Get Raided
Investment Rarities - SILVER IN AN UNCERTAIN WORLD
Casey Research - Where (and When) to Place Your Investment Bets?
Minyanville - Reflections on the Financial Crisis
Seeking Alpha - Precious Metals In A Tough Situation
VIDEO (05:13) : Global Collapse Explained
04/04/12 - Bullion News
MineWeb - U.S. economic prospects and the price of gold - an appraisal
Seeking Alpha - Fed's Actions Speak Louder Than Words
Kitco - The 2012 Copper & Gold Conundrum
VIDEO (28:00) - Capital Account; Marc Faber, "The Ego of Mr. Bernanke has been Badly Inflated"
Silver Doctors - 637.5 MILION OUNCES OF PAPER SILVER DUMPED IN 1 HOUR AFTER FED MINUTES RELEASED
GoldSeek - Exactly Why This Time IS Different And the Fed Will Be Powerless to Stop What's Coming
04/03/12 - Bullion News
CoinNews - American Eagle Gold, Silver Bullion Sales Bounce in March but Down from 2011
Casey Research - The Critical Number for Gold (When is it time to Sell...)
CoinWeek - Gold Market “To See Little Business” This Week with India Striking and China Closed
VIDEO (12:26) : 'US next Greece if debt is not dealt with'
Yahoo News - Recovery threatened by runaway student loan debt
Bullion Bulls Canada - U.S. Standard of Living Has Fallen More Than 50%
VIDEO (20:23) : Ellis Martin Report with Sprott Money's CEO Eric Sprott
The Gold Report – Gold and silver-the ultimate anti-fiat currency vs Fed's ‘sophisticated swindle'
MineWeb – India's imports of gold and silver tumble in Q1
04/02/12 - Bullion News
VIDEO (15:01) : GoldSeek – Eric Sprott and Rick Rule Skewer the U.S. with James West on Midas Letter Money
SafeHaven – Gold - Is It About 'Price' or About 'Value' - Balanced Article!
Article & VIDEO (06:35) : CNBC – 'Massive Wealth Destruction' Is About to Hit Investors: Marc Faber
Dollar Collapse – We Owe How Much??
Financial Sense – The Problem with the Fed’s Zero Rate Policy; Jim Rickards’ submitted testimony to the Senate Banking Committee’s Subcommittee on Economic Policy
Coin Update – Perth Mint 2012 Year of the Dragon Silver 10 Coin Set
Gold & Silver Blog – Gold and Silver Bullion Coin Sales Rise In March
VIDEO (16:40) : Money Talks INTERVIEWS David Morgan
ZeroHedge – BRICs Bank To Rival World Bank And IMF And Challenge Dollar Dominance
Perth Mint Bullion Blog – Perth Mint Strikes Gold And Silver 10 Kilo Dragon Coins
eCoronado – Lifetime Local Finds $410,000 in Silver Coins from S.S. Monte Carlo Wreckage
CoinWeek – The Coin Analyst: Canadian Mint Plans to Stop Making Cents, and the U.S. Should Do the Same
VIDEO (06:19) : Got Gold Report – Jim Grant – Will Open Office of Unintended Consequences
04/01/12 - Bullion News
The Real Asset – Olympic gold mine discovered in UK
Wall St. Cheat Sheet – Should Investors Activate Gold and Silver Airbags?
Inside Futures – The Euro Currency And Federal Reserve Policy
Business Insider – The Next 24 Hours Will Be Critical For The Global Economy
VIDEO (05:13) : China Makes Fake Silver For U.S. Markets
Total Investor – Fantastic op-ed: These four numbers will bankrupt America
AUDIO (03:16) : 1965 Flashback – Paul Harvey - If I Were The Devil
For Bullion Market News...
|
Support this Guide & Paypal Thank You for Your Support |
|
|
 | |||||
Free Bullion Investment Guide
Keep this Guide Online
& Paypal
Thank You for
Your Support
Search the Guide
| search engine by freefind | advanced |

Daily
Newsletter
Mintages
for
2024
Gold & Silver Mexican Libertad
|
Gold Libertads |
Chinese Gold Coin Group Co.
& Chinese Bullion
2025
Gold & Silver Chinese Panda
|
Silver Panda |
Help Us Expand our Audience by forwarding our link
www.free-bullion-investment-guide.com.
Thank You!
March's

All Articles were Originally Posted on the Homepage


Click Ad to Request a Free Appraisal Kit
ExpressGoldCash
Customer Reviews 4.9 stars


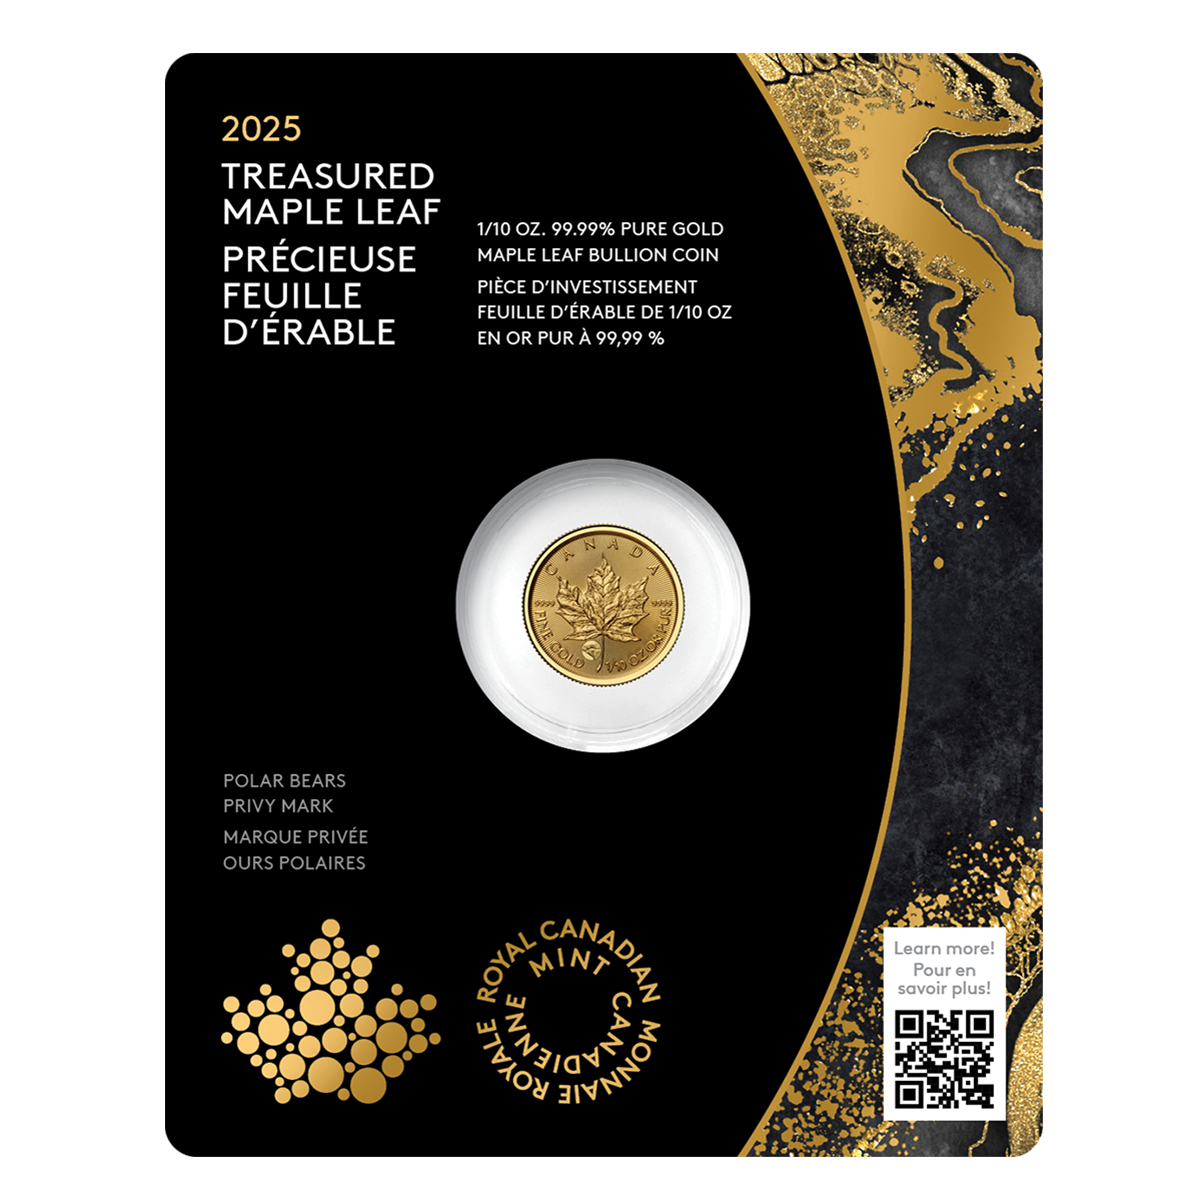
Polar Bears Privy
Give a lasting gift of the iconic Gold Maple Leaf bullion coin with a special privy mark. [More]
Free Shipping on Orders over $100 (CDN/USA)

