Why Did Gold and Silver Fall?
Some Answers as to Why the Precious Metals fell during the week of 7/03 thru 7/07/2017
Originally Posted on 07/10/2017 @1:15 am
by Steven Warrenfeltz
Subscribe to this Blog
Hello,
Thank you for visiting the Free-Bullion-Investment-Guide's latest blog, I hope that you and your family had a Happy and Safe 4th of July.
It has been two weeks since my last blog post, so before we get to this week's post below are some of Best News Articles from the last two weeks that were taken from this guide's home page.

"Foolish Pride" - Yellen: Banks 'very much stronger'; another financial crisis not likely 'in our lifetime' - CNBC
Yellen's Hubris: Is She Repeating Bernanke's Big Mistake? - Hedgeye
07/06: Massive Buy Signal: Goldman Bails on Commodities - Daily Wealth
CHARTS : A Look at NYSE Margin Debt and the Market - Advisor Perspectives
The BIS and the Global Debt Bubble - The BIS’s principal concern is that global debt to GDP levels today are some 40 percent higher than they were on the eve of the 2008-2009 global market meltdown. - AEIdeas
Credit, Finance and Market Stability - Advisor Perspectives
Owning Gold Is the First Step to “Freedom Insurance” - Casey Research
A Tale of Two Gold Markets - Daily Reckoning
Shrinkflation – Real Inflation Much Higher Than Reported - Zero Hedge
Best of the Week for Nano-Particle Cancer Research
GOLD NANOTECHNOLOGY : CANCER RESEARCH : Thwarting metastasis by breaking cancer's legs with gold rods - The experimental treatment also spared healthy cells, in these and in prior experiments, making the method potentially much less taxing on patients than commonly used chemotherapy. - Medical Press
GOLD NANOTECHNOLOGY : CANCER RESEARCH : Experts develop cancer cure that spares normal cells - Deccan Chronicle

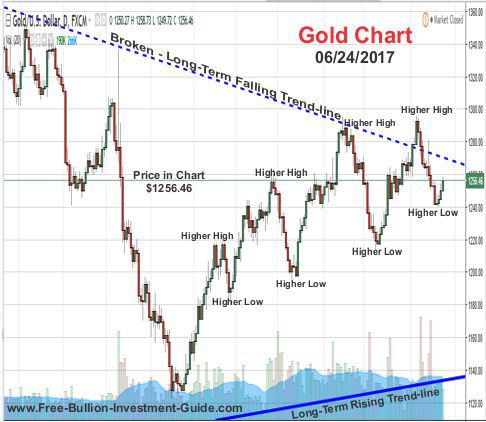
Prior to two weeks ago, the gold market was looking optimistic, gold had successfully made higher highs and higher lows, plus it had broken a 6-year falling trend-line and the dollar was falling.
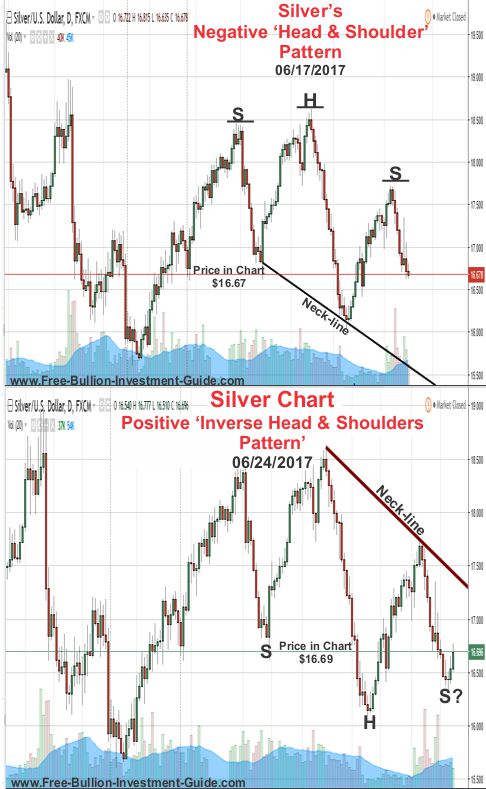
Silver’s market, on the other hand, was looking confused, its price chart had formed a positive and a negative head and shoulders patterns, but it wasn't offering any clear indication as to which way it was going to move.
In the chart below, Gold had also formed positive and negative head and shoulders patterns but they had formed in its MACD and RSI (Relative Strength Index), not in its candlestick chart.
Note: In the Silver Charts above and the Gold charts below, the question marks should have been beside each right shoulder because a ‘head and shoulders’ pattern cannot be confirmed until its neck-line is broken.
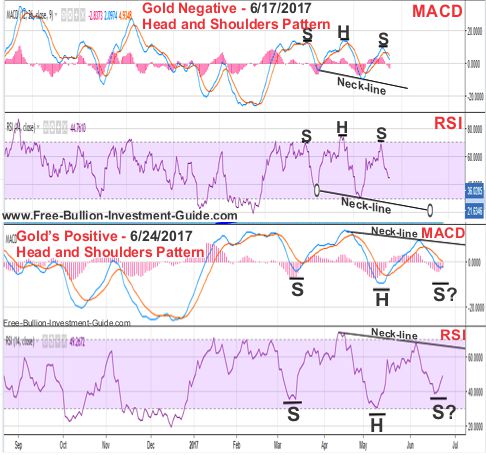
The negative 'head and shoulders' patterns in Gold's MACD and RSI did cross their necklines confirming the negative pattern, but the question is:
Why did gold and silver drop so dramatically because nobody saw it coming?
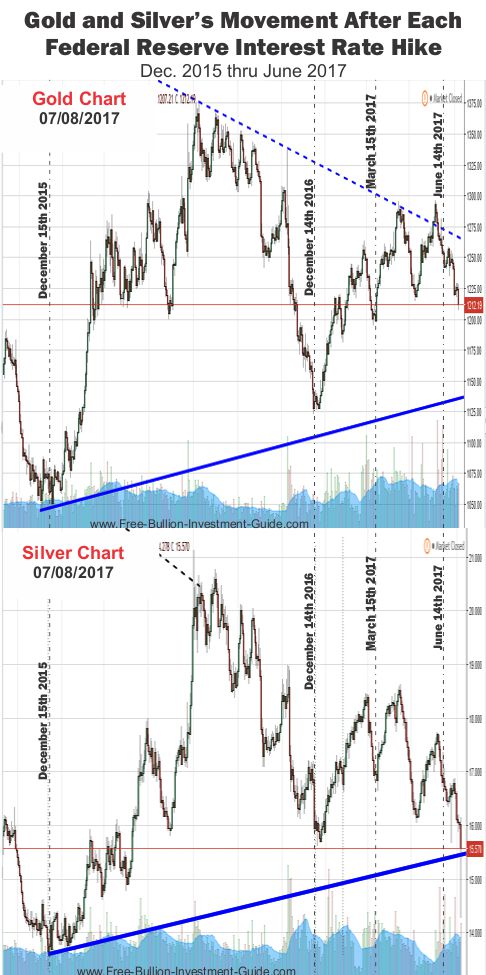
Many in the financial media say the drop in gold and silver is the result of the Fed raising Interest rates on June 14th.
However, since the Federal Reserve started to raise the interest rate on December 2015, the price of gold and silver fell dramatically before the rate hike, not after it, except for this time.
Charts provided courtesy of TradingView.com
What’s different this time?
On June 28th, the Federal Reserve gave U.S. banks their blessing to buy back their own stock.
Fed gives big U.S. banks a green light for buyback, dividend plans - Reuters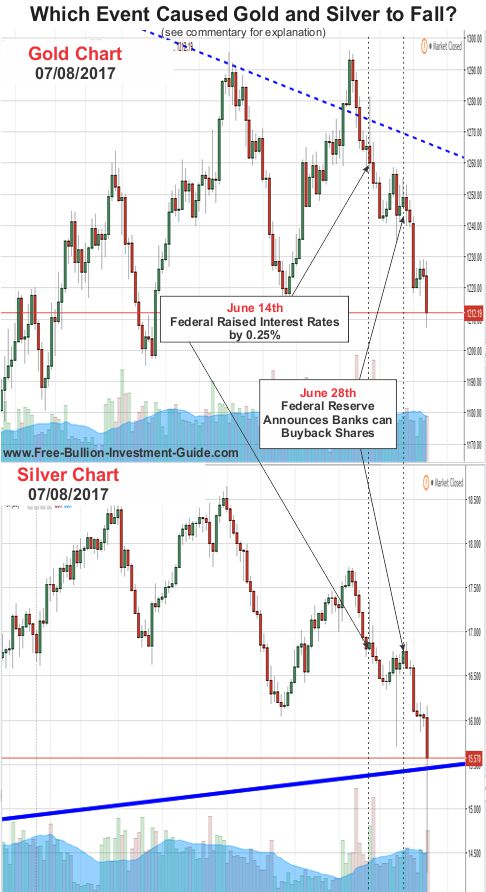
So what did this do to the markets?
It told them that the financial sector's stock prices are going higher because buybacks make it possible for companies, or banks in this case, to increase their earnings and stock prices by doing nothing but buying back their own shares.
Higher stock prices often mean lower precious metals prices, this is why a lot of investors watch the dow to gold ratio because gold and stock markets move in opposite directions.
As you can see in the chart above, gold and silver did drop
a little after the last interest rate hike, but they also put in
higher lows, it wasn’t until after the Federal Reserve made the ‘Buy Back / Dividend’ announcement
that gold and silver had their big drops in price.
More Clues
There are a few more clues as to why gold and silver fell that are related to this event.
You may or may not recall this, but there was a flash crash in the metals markets on June 26th, it was called a 'Fat Finger' episode.
But perhaps that fat finger episode was caused by someone who knew something about the banks passing the stress test before it was announced.
Gold Flash Crashes As "Someone" Dumps $2 Billion, "Fat Finger" Blamed - Zero HedgeOne could say that this is complete speculation, however, Janet Yellen said the day after the ‘Fat Finger’ episode and the day before the Bank Buy Back announcement, the following:
Yellen: Banks 'very much stronger'; another financial crisis not likely 'in our lifetime' - CNBCThis is my take on the dramatic drop in Gold and Silver, there are a lot of other people out there who are making their own cases for the drop.
But, I'll let you make up your own mind on who's right and who's wrong.
Gold and Silver Outlook
After last week’s price drop, almost all technical patterns have been destroyed in the metals charts.
However, Silver and Gold are still trading above their rising trend-lines (the rising blue line in the charts above), but silver is trading very close to it and if it breaks below this line, the immediate future does not look bright for the precious metals.
But this week, I'm going to let fundamentals and time show which way the metals will go before I try to apply technical analysis to help forecast price movement.
So until next week, Thank You for Your Time and Have A Great Week.
God Bless,
Steve
'Click Here' see all of the prior Blog posts,
Thank You for Your Time!
|
Support this Guide & Paypal Thank You for Your Support |
|
|
 | |||||
This website is best viewed on a desktop computer.
Keep this Guide Online
& Paypal
Thank You for
Your Support
with Feedly
Search the Guide
| search engine by freefind | advanced |
Premium Canadian Bullion

Give a lasting gift of the iconic Silver Maple Leaf bullion coin [More]
Free Shipping on Orders over $100 (CDN/USA)
or
From the U.K. Royal Mint


Daily
Newsletter
Updated Mintages for
American Gold Buffalo
American Gold Eagle
American Silver Eagle
2024 & 2025
Jerusalem of Gold Bullion
Coin photos
(bottom of page)
Mintages
for
2024
Gold & Silver Mexican Libertad
|
Gold Libertads |
Chinese Gold Coin Group Co.
& Chinese Bullion
Help Us Expand our Audience by forwarding our link
www.free-bullion-investment-guide.com.
Thank You!
Last Month's

In No Particular Order
January 2026
All Articles were Originally Posted on the Homepage


