
ExpressGoldCash - 4.9 star - Customer Reviews
The US Budget Deficit & Gold
plus
Gold, Silver and the US Dollar
Review and Weekly Outlook
Originally Posted on 10/16/2016 @3:52pm
by Steven Warrenfeltz

✞✟✞

A lot of Americans hear about the High Budget Deficit and how it will erode our economy and everything we hold dear.
However, few know the antidote that an individual can own to help protect themselves from the rising deficit and its eroding effects on our lives.
First, one of the biggest misinterpretations I find people make is mixing the terms’ deficits’ and ‘debt’ together.
So what’s the difference between a Deficit and Debt?
A deficit happens when an entity or government spends more than it collects in a particular period, and Debt is the total sum of the accumulated deficits.
Why is the Deficit Going to Get Bigger?
For the last year or two, I’ve posted on the homepage, news articles from a blog called 'Econimica' (the blog was originally named 'Hambones Stuff’).
I have no affiliation with the site, nor did I contact the author of the site before this post; I am simply pointing it out to you because the author has been writing (repeatedly) about critical subjects that go to the heart of a rising deficit question.
The subjects being: the Aging Population and Population growth and decline, and how it will ultimately affect the U.S. and Global economy and our lives, with higher deficits and debt.
Government overspending is what causes deficits and debt, but if you don’t have a productive economy with more young workers than old, you won’t be able to combat the problem, and it will continually get worse.
|
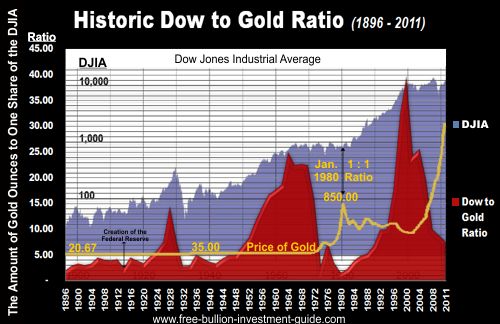
In 1968, the Doors produced a song titled “5 to 1.” The title of the song was based on the ratio that there were 5 youths to 1 older individual. Today, that ratio sits around 2 to 1, and within a generation, the ratio will be closer to 1 to 1. |
|
The author of Econimica doesn’t always point out to you that our failing population demographics will lead to higher deficits, but it’s staring you in the face as you read it.
It would be a disservice to you if I wrote at length about these issues because of the time and effort that Econimica’s author has put into these articles. Here are a few of the articles from Econimica that will help you understand this issue better:
Here are just a few of the articles from Econimica that will help you understand this issue better:Econimica - The Myth That America's Superior Demographics Can Save It (web archive page - edit)
Econimica - US Popualtion Growth & Fed Funds Rates Correlated...Until Now!?! (web archive page - edit)
Furthermore, here are the Federal Reserve's numbers on the issue:
FRED Blog - Mapping the young and the old
If you want to understand this issue, I would suggest that you may want visit Econimica, because it covers the demographics issue better than any other site I’ve found.
The Antidote for the
Individual against Higher Deficits
The problem isn’t going to improve anytime soon. Gold and other precious metals are some of the few options that can help individuals when these problems really start to get out of control.
A good chart about this was recently tweeted by Tom McClellan of McClellan Financial below:
.@jessefelder Federal deficit is better explainer of gold price movements than those factors. If you think deficit going higher, own gold. pic.twitter.com/M1r71Gc2KG
— Tom McClellan (@McClellanOsc) October 12, 2016
GOLD
Last week, gold didn’t move significantly; it mostly traded sideways and consolidated after taking a big fall in its price the week before.
In the immediate future, gold’s MACD and RSI are treading in oversold territory; the last time we saw gold this low in the MACD and RSI was in January, when it hit multi-year lows, so we should see gold’s price rise next week.
Furthermore, the red and black vertical lines on the right side of the gold price chart, below, indicate when the next Fed Meeting happens on Nov.2nd and the U.S. Elections on Nov. 8th, both events will give some future direction to the price of gold.

Charts provided courtesy of TradingView.com
Gold's Price Resistance and
Support Levels
Gold's Resistance Level
$1300.00
$1290.00
$1270.00
Gold's Support Levels
$1250.00
$1225.00
SILVER
In last week's post, seen here, I posted this silver chart, which shows the price of silver breaking below a bullish Falling Wedge and a bullish Ascending Channel.
Given that both of these patterns were positive patterns and the price actions were not expected, it indicates a negative future for the price of silver. (continued...)

Charts provided courtesy of TradingView.com
This week, I found a new rising trend line that is positive for silver’s price.
A trend line is a visual representation where two or more points connect to make a line, in any time frame. On the chart below, I show you where the support levels are for this new rising trend line.
Also, silver’s MACD and RSI are bottoming. Silver’s RSI hasn’t been this low since January (indicated on the chart, below), and its MACD hasn’t been at this level since before its multi-year low in January, so we should see some reversal this week. (continued...)

Charts provided courtesy of TradingView.com
Silver's Price Resistance and
Support Levels
Silver's Resistance Level
$18.50
$18.00
$17.75
Silver's Support Level
$17.25
$17.05
$16.90
US DOLLAR
Last week, the U.S. Dollar broke above the falling trend line indicated in the chart below.
This week, the U.S. Dollar price in the chart below kept moving above its falling trend-line, and it is currently sitting just below the $98.25 resistance level.
This is a positive for the U.S. Dollar; however, the dollar’s MACD and RSI are both topping out in overbought territory, so next week the U.S. Dollar should move lower. (continued...)

Charts provided courtesy of TradingView.com
U.S. Dollar's Price Resistance and Support Levels
U.S. Dollar's Resistance Level
$99.00
$98.50
$98.25
U.S. Dollar's Support Level
$97.50
$96.90
$96.50
To see all prior Bullion Market Analysis Blog posts.
Go to this Guide's Blog page here, or see our Archive page on Tumblr.
Thank You for Your Time!
Take Care & God Bless (✞✟✞)
Other pages, on this Guide, that you
may like...
|
|

|


|
Support this Guide & Paypal Thank You for Your Support |
|
|
 | |||||

Recent Articles
-
Newsletter of the Free Bullion Investment Guide - May 2026
May 05, 26 02:25 PM
 The May 2026 newsletter of the Free Bullion Investment Guide provides the latest updates, fundamental and technical gold and silver market analysis, the best articles from last month, and a list of re…
 -
Newsletter of the Free Bullion Investment Guide - April 2026
Apr 05, 26 04:44 PM
 The April 2026 newsletter of the Free Bullion Investment Guide provides the latest updates, fundamental and technical gold and silver market analysis, the best articles from last month, and a list of…
 -
Newsletter of the Free Bullion Investment Guide - March 2026
Mar 04, 26 02:08 PM
 The March 2026 newsletter of the Free Bullion Investment Guide provides the latest updates, fundamental and technical gold and silver market analysis, the best articles from last month, and a list of…
 -
Newsletter of the Free Bullion Investment Guide - February 2026
Feb 07, 26 02:12 PM
 The February 2026 newsletter of the Free Bullion Investment Guide provides the latest updates, fundamental and technical gold and silver market analysis, the best articles from last month, and a list…
 -
Newsletter of the Free Bullion Investment Guide - January 2026
Jan 07, 26 04:07 PM
 The January 2026 newsletter of the Free Bullion Investment Guide provides the latest updates, fundamental and technical gold and silver market analysis, the best articles from last month, and a list o…

18W LED Security Light (Dusk to Dawn & Motion Sensor) - $32.99
from:
 LED Lighting

) (as of March 11, 2011)")
This website is best viewed on a desktop computer.
Keep this Guide Online
& Paypal
Thank You for
Your Support
with Feedly
Search the Guide
| search engine by freefind | advanced |

Give a lasting gift of the iconic Silver Maple Leaf bullion coin [More]
Free Shipping on Orders over $100 (CDN/USA)
The Sovereign 2026 Gold Bullion Coin in Card

Britian's
Royal Mint

Daily
2026 Silver Kookaburra
Photo & Mintage Update

Newsletter
Mintages & Photos
|

|
Silver Panda |

Mintages
for
2024
Gold, Silver, & Platinum
Austrian Philharmonic Bullion Coins

|
Silver Philharmonics  |
Platinum Philharmonics

Platinum and Palladium Bullion


Mintages
for
2025
Gold & Silver Mexican Libertad
|
Gold Libertads |


Updated Mintages for
American Gold Buffalo
American Gold Eagle
American Silver Eagle


Help Us Expand our Audience by forwarding our link
www.free-bullion-investment-guide.com.
Thank You!
Last Month's

In No Particular Order
April 2026
|
All Articles were Originally Posted on the Homepage Gold Nanoparticle Cancer ResearchSona Nanotech’s Hyperthermia Platform Boosts Immunotherapy Response in Colorectal Cancer Study - Tipranks Sona Nanotech Showcases Cancer Therapy Results At Prestigious Industry Cancer Conferences - Financial Times Development of gold nanostars coated with mesoporous silica for chemo-photothermal therapy - Published Research Paper - Journal of Drug Delivery Science and Technology (Science Direct) |
All Articles were Originally Posted on the Homepage