Silver and Gold are
Moving on Up
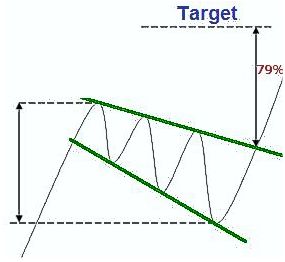
in their short-term trade
Precious Metals Review and Outlook from
10/09 thru 10/20/2017
Originally Posted on 10/16/2017 @ 11:01 am
by Steven Warrenfeltz
Subscribe to this Blog
Hello,
Thank you for visiting the Free-Bullion-Investment-Guide's latest blog post, before we get to the precious metals review and outlook, below are some of last week's Best Bullion Market-Related News articles that were taken from this guide's home page.

Gold as the Monetary Sun - Casey Research
Tale of Two America's - South - Econimica
2018 Australian Kookaburra Silver Bullion Coins Available - Coin News
Why MarketWatch’s “Seven Reasons To Sell Gold Now” Aren’t Good Reasons At All - Hard Asset Alliance
Gold Has Potential To Hit $1,400 By Next Year – Macquarie - Kitco
Best of the Week for Gold NanoParticle Cancer Research
GOLD NANOPARTICLE - CANCER RESEARCH: Lung cancer being targeted by nano-drone delivered cannabinoids - lift news
GOLD NANOPARTICLE RESEARCH: Gene Editing: Gold Nanoparticle Delivery Shows Promise - National Institute of Health (NIH)

Review & Outlook
Commentary Layout
Each asset below has three sections.
1) In the 'review' section, a copy of the previous outlook for that asset is posted.
2) Next, you'll find a 'review - continued' section where there is a brief review of how accurate the previous outlook was.
3) Finally, you will find an 'outlook for the week ahead' for each of the assets below.
All the charts on this blog are Daily Charts unless noted otherwise.
SILVER
In Review
Below is silver's commentary and chart outlook from last week.
In the week to come, silver should continue to turn up in price, both of its lower indicators (RSI & MACD) are agreeing that this should happen.
In addition, although we may see the price rise this week, technically we'll also probably see the price of silver consolidate around the $16.95 to $17.15 level.
However, fundamentally, tensions with North Korea are back on the rise, so the price of silver (and gold) may break through its resistant levels in the week to come.
In Review - continued
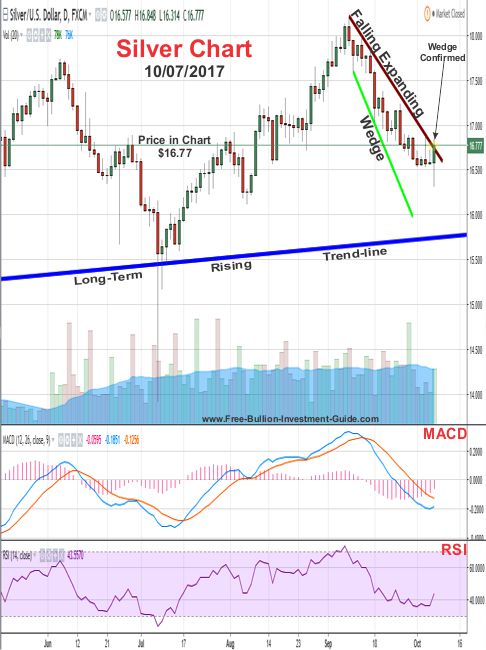
The price of silver did continue to rise last week.
In the chart below, I've highlighted the area that I stated that the price may slow and consolidate. Silver's price did consolidate but not by much, it basically continued to move up.
In addition, as mentioned last week, the tensions between North Korea and the United States remain elevated which continues to help the precious metals rise.
Silver - This Week's Outlook
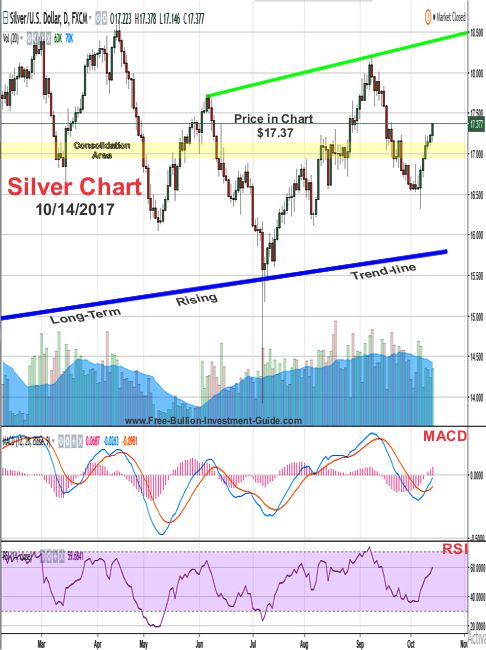
For the week to come, I didn't point out any new patterns in the chart below because no clear trend-lines have been identified except the bottom long-term trend-line that dates back to December 2015.
However, in the chart below, you'll also notice a un-named 'green' trend-line.
This trend-line could be the 'Neck-line' of a possible 'Inverse Head and Shoulders' pattern or it could simply be a resistance line, more time needs to pass before it can be determined how this trend-line can be identified.
However, ultimately for the week to come, silver's MACD and RSI are showing that its price has more room up to move, plus, last week's consolidation area will become a support level for the price of silver.
Charts provided courtesy of TradingView.com
Silver's Price Resistance &
Support Levels
Silver's Resistance Levels
$17.75
$17.50
Silver's Support Levels
$17.15
$16.95
GOLD
In Review
Below is the gold outlook from last week.
For the week to come, like silver, gold's MACD and RSI are both indicating that the price of gold should start to turn up at the beginning of next week.
As gold rises it will most likely start hit resistance between $1290 - $1310, so we should see some consolidation at this level.
Unless the tensions between the United States and North Korea escalates again, or some other unforeseen act happens then we may see the safe haven continually rise throughout the week. Time will tell.
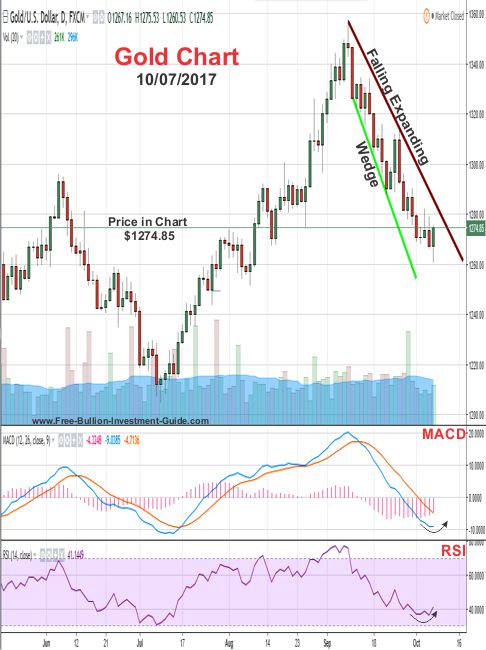
In Review - continued
In the chart below, you can see that last week gold 'confirmed' the 'Falling Expanding Wedge' pattern.
However, it is still trading inside the consolidation area (zone) that I mentioned in last week's post.
Gold - This Week's Outlook
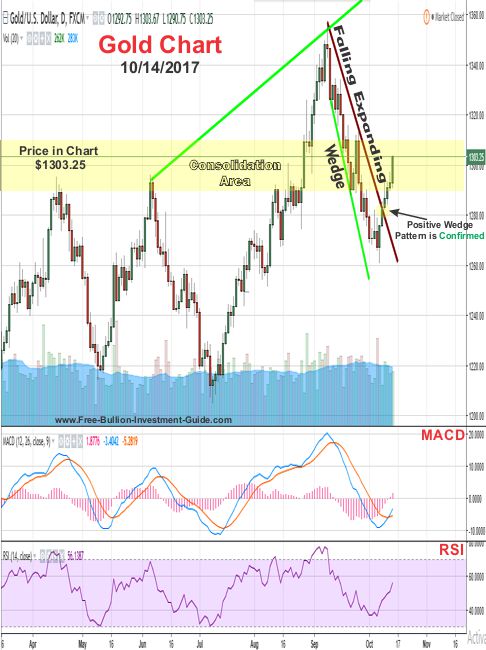
In the chart below, for the week to come, like silver, no clear patterns have formed.
But, Gold's MACD and RSI are indicating that gold's price has more room to rise this week, some consolidation along the way is always expected.
Lastly, like silver, I've put in the chart below a un-named 'green' trend-line, and like silver, this could either be the Neck-Line of an 'Inverse Head and Shoulders' pattern or it could simply be a resistance trend-line.
However, it's too soon to tell, I've been seeing the 'Inverse H&S' pattern in the charts for over a month now and I thought I'd finally make you aware of it if you haven't already been watching it yourself.
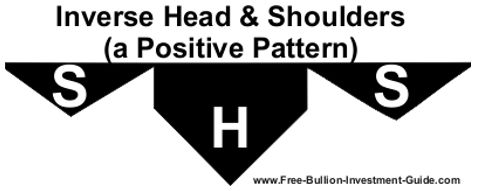
If the pattern pans out, its outcome will be a very positive intermediate trade pattern for both gold and silver, but its way too early to say which way it will go; I'll keep you updated on it as time goes by.
Charts provided courtesy of TradingView.com
Gold's Price Resistance and
Support Levels
Gold's Resistance Levels
$1350.00
$1310.00
Gold's Support Levels
$1280.00
$1250.00
US DOLLAR
In Review
Below is the U.S. Dollar's commentary and chart from a week ago.
For the week to come, nothing new has shown up on the chart.
The negative 'Rising Expanding Wedge' is still looming over the dollar so sometime this week we should see the price of the dollar start to retreat.
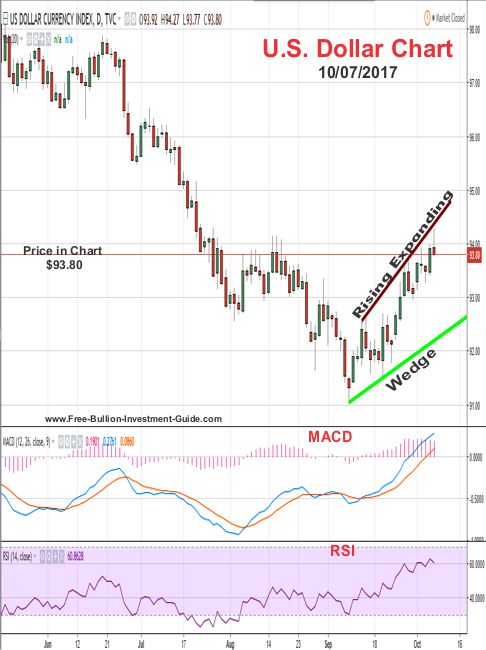
In Review - continued
In the chart below, the U.S. dollar continued to retreat in price, but it still has not confirmed the negative 'Rising Expanding Wedge' looming over it.
U.S. Dollar - This Week's Outlook
For the week to come, the U.S. Dollar's MACD and RSI are both indicating that the price has more room to fall.
So it looks like this week we should see the negative pattern confirmed, time will tell.
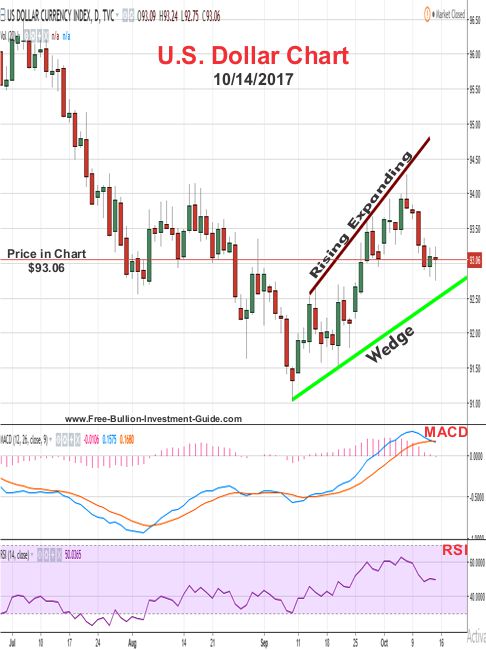
Charts provided courtesy of TradingView.com
U.S. Dollar's Price Resistance and Support Levels
U.S. Dollar's Resistance Levels
$94.00
U.S. Dollar's Support Levels
$93.00
$92.00
TNX -
Ten-Year Treasury Note
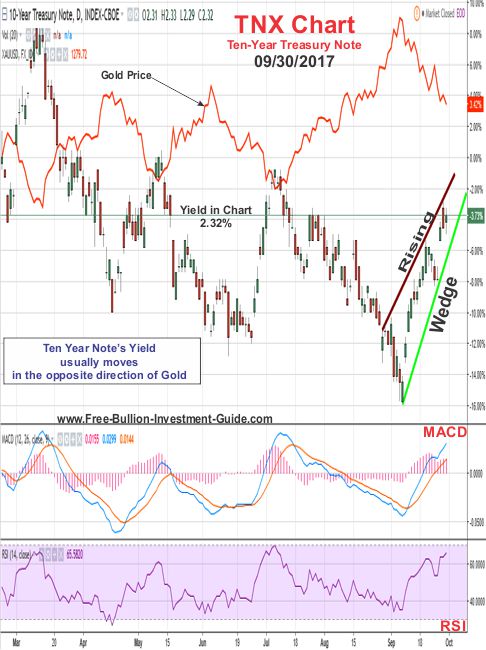
Two weeks ago, I did a review of the TNX and below is the commentary and chart from that blog post.
In Review
The TNX, Ten-year Treasury note, is a chart that I often watch to get an idea of what gold will do because the TNX almost always moves in the opposite direction of gold, you can see this in the TNX chart below.
You can also see, in the chart below, that the Ten-year treasury note has formed a negative 'Rising Wedge' pattern.
Time will tell when the pattern is confirmed, I'll update you when it does.
In Review - continued & Outlook
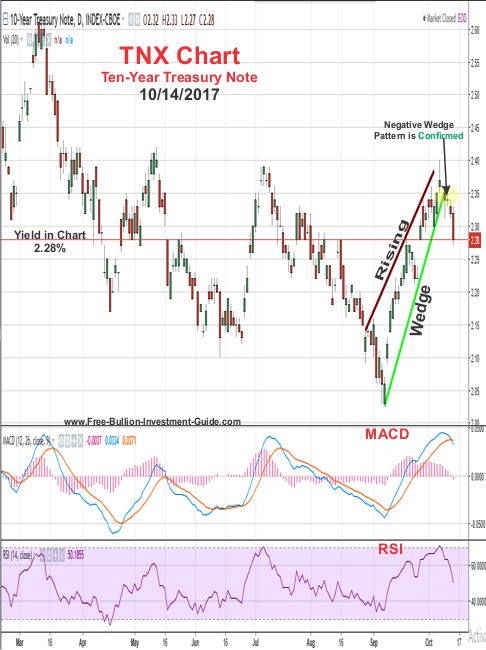
Last week, the negative 'Rising Wedge' pattern in the TNX chart was confirmed, ironically enough, this happened at the same time gold's positive 'Falling Expanding Wedge' was confirmed.
I will revisit the TNX chart again in the future, but no patterns have been identified at this time, although its MACD shows that more downside will most likely happen this week.
Charts provided courtesy of TradingView.com
Bitcoin
In Review
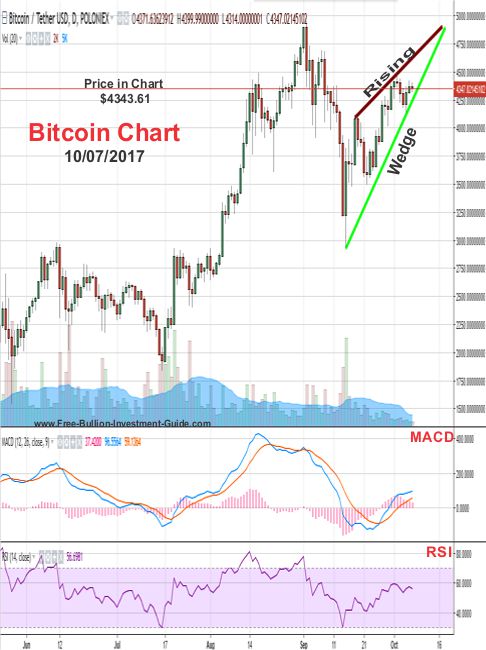
Below is last week's Bitcoin outlook.
In the Bitcoin chart, a negative 'Rising Wedge' pattern has formed.
Its hard to say when the pattern will play itself out, but I'll update you when it does.
In Review - continued & Outlook
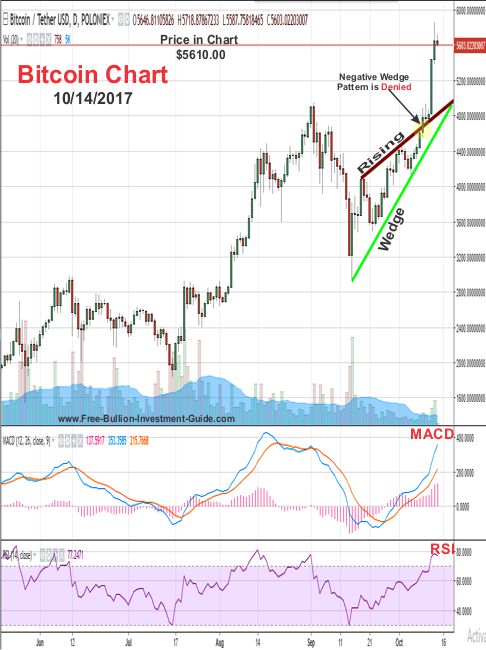
In the chart below, you can see that no less than a few hours after I posted last week's blog post, Bitcoin denied the 'Rising Wedge' pattern.
Last week, below the Bitcoin chart, I posted the following:
Full disclosure: I own some crypto-currencies, but I do not currently own bitcoin.
That statement is still true, what is also true is that Bitcoin is very volatile, and I rarely view its 'daily' chart to follow Bitcoin or any other crypto-currency's price.
For crypto-currencies, I usually look at smaller interval charts, 4-hr. to 5-min. charts, however on this blog I only use 'daily' charts, so for that reason, I doubt I'll be revisiting Bitcoin anytime in the near future.
Charts provided courtesy of TradingView.com
Thank You for Your Time.
Have a Great Week.
God Bless, Steve
'Click Here' see all of the prior Blog posts,
Thank You for Your Time!
|
Investment/Information Disclaimer: All content provided by the Free-Bullion-Investment-Guide.com is for informational purposes only. The comments on this blog should not be construed in any manner whatsoever as recommendations to buy or sell any asset(s) or any other financial instrument at any time. The Free-Bullion-Investment-Guide.com is not liable for any losses, injuries, or damages from the display or use of this information. These terms and conditions of use are subject to change at anytime and without notice. |
|
Support this Guide & Paypal Thank You for Your Support |
|
|
 | |||||
Free Bullion Investment Guide
Keep this Guide Online
& Paypal
Thank You for
Your Support
Search the Guide
| search engine by freefind | advanced |

Daily
Newsletter
Mintages
for
2024
Gold & Silver Mexican Libertad
|
Gold Libertads |
Chinese Gold Coin Group Co.
& Chinese Bullion
2025
Gold & Silver Chinese Panda
|
Silver Panda |
Help Us Expand our Audience by forwarding our link
www.free-bullion-investment-guide.com.
Thank You!
March's

All Articles were Originally Posted on the Homepage
