Merry Christmas
and a
Happy New Year
'Review & Outlook'
for the U.S. Dollar, Silver, and Gold
Originally Posted on 12/25/2018 @ 8:15 pm EST
Last Edited & Updated on 12/26/2018 @ 9:47 am EST
by Steven Warrenfeltz
Subscribe to this Blog
Hello,
Thank you for visiting the Free-Bullion-Investment-Guide, every visit you make is greatly appreciated.
Before we get to this Review & Outlook, below are some of the Best Bullion Market-Related News articles that were taken from this guide's home page, over the last several weeks.

GM, Bailouts, and the Importance of Bankruptcy in Market Economies - FEE
Global Chaos Makes Gold a Holiday Winner for Hedge Funds - Bloomberg
Bitcoin is not a bubble - The Library of Economics and Liberty - EconLog
Asia Gold- Higher prices and holiday season keep buyers at bay - Reuters
2019 American Eagle and Buffalo Bullion Coins Launch Jan. 7 - Coin News
House rich and money poor: Deal with your debt, you've been warned - Yahoo Finance
The Great Reset, Long Overdue, May Now Have Arrived - Advancing Time
Government Spent Nearly $8 Trillion in FY 2018 - FEE
Pensions Are The Biggest Ponzi Scheme Of Man - Advancing Time
2019 Gold Price Forecasts and Predictions from the Big Investment Banks - Gold Silver
US Banks Disclose Biggest Unrealized Losses on Security Investments since Q1 2009: FDIC - WolfStreet
Best of
Gold NanoParticle Cancer Research News
An update on Frank Billingsley's (KPRC2 chief meteorologist) Battle with Prostate Cancer in Gold Nanoparticle Cancer Research - Human Trial - Click 2 Houston
Gold “nanoprisms” open new window into vessels and single cells - Stanford Medicine
GOLD NANOPARTICLE CANCER RESEARCH: Nanoparticles developed at Rice reach clinical trials for prostate cancer - Rice University
To begin this 'Review and Outlook,' I hope you and your family had a Merry Christmas and have a Safe and Happy New Year!
I believe in accountability, which is why in every 'Review and Outlook,' there is an honest assessment of the last outlook in the 'review - continued' section.
This time, I wanted to review some of what was written in the intro of my last blog post titled: Silver and Gold's Price Movement Depends on 'The Fed.'
In the last sentences of the intro, I was half right and half wrong; below is what was written:
|
What the market doesn't like is that through interest rate hikes, the Federal Reserve is trying to tame it. I will be surprised if they don't tame the market too much before the bottom falls out of it, but time will be the judge of that. My prediction is that 'The Fed' will raise interest rates another quarter of a percent on December 19th, and ultimately Gold and Silver will likely be affected negatively from it. |
Last week, 'The Fed' did raise interest rates, by another quarter of a percent, however, gold and silver were not affected negatively from it, as you will see in the charts below.
Instead, gold and silver rose in price, which has been mostly due to all the uncertainty in the markets, so, I was wrong in my prediction of gold and silver's price movements, after the rate hike.
However, when viewing the charts using Technically analysis, they indicate that gold and silver are trading in negative patterns and should see some kind of pullback, sometime in the near future.
This is unless fundamentals take over and market uncertainty increases.
Fundamentals always trump Technical Analysis, and Uncertainty is a Precious Metal's best friend.
Review & Outlook
|
All the charts on this blog are Daily Charts unless noted otherwise.
US DOLLAR
In Review
In each of the 'In Review' sections of this blog, you'll find analyzes the last blog post's outlook.
Below is the analysis and chart from this guide's last blog's outlook for the U.S. Dollar.
|
The dollar's been moving mostly sideways for the last few weeks, without much of a direction as to which way it will move. Traders can't seem to make up their mind on what they want to do until after the Federal Reserve meeting. The U.S. Dollar has formed a broad 'Falling Expanding Wedge' which it is expected to trade inside until after the Federal Reserve has announced what it will do in regards to Interest Rates on December, 19th. The pattern is a positive pattern, so the dollar is expected to rise above it sometime in the near future, most likely, the pattern will either be confirmed or denied after the FOMC meeting. |
U.S. Dollar - In Review - continued
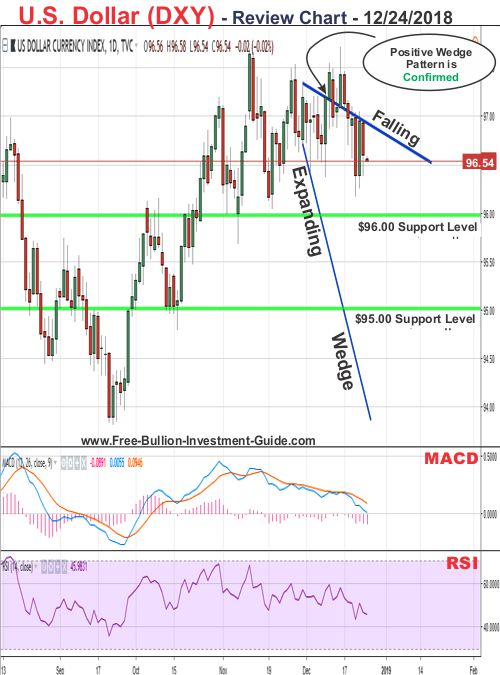
In the Review chart below, you can see that the dollar didn't wait for the Fed's interest rate hike to move up, it popped up through the 'Falling Expanding Wedge' two days after the chart above was posted.
But, because of all the uncertainty in the markets, the dollar has failed to stay above the pattern.
U.S. Dollar - Outlook
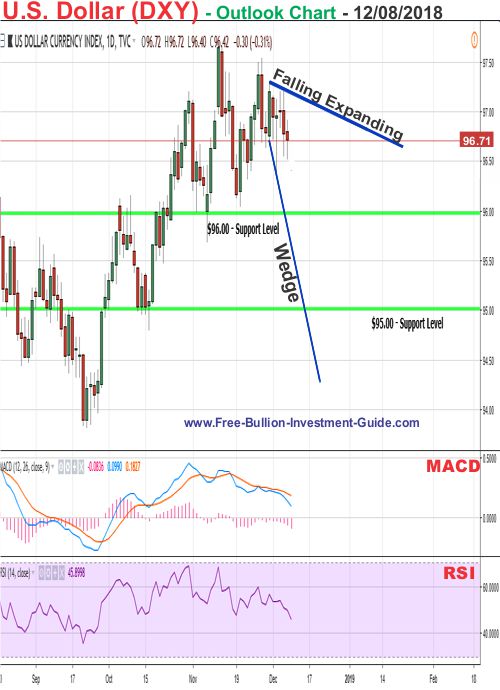
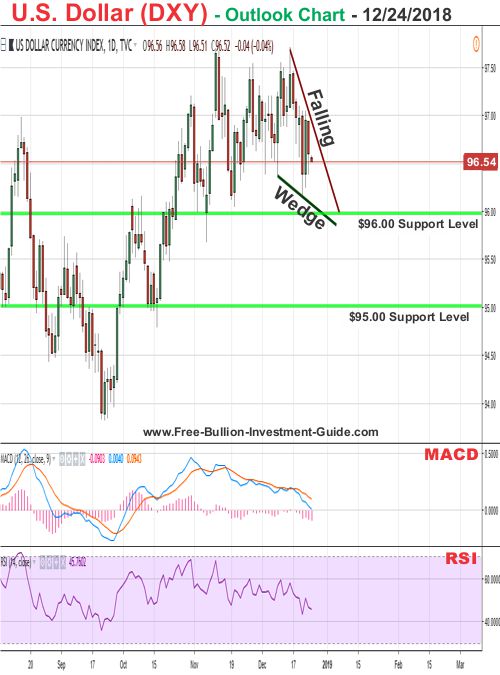
In the U.S. Dollar's outlook chart, below, a positive 'Falling Wedge' pattern has formed.
The dollar looks to have some room to trade in the positive pattern before it moves up to break and confirm the pattern, it's unknown as to whether that will happen before or after New Year's Day, but it should happen soon.
Charts provided courtesy of this Guide's Affiliate - TradingView.com
U.S. Dollar's Price Resistance and Support Levels
U.S. Dollar's Resistance Levels
$98.00
$97.00
U.S. Dollar's Support Levels
$96.00
$95.00
Free Shipping on Orders $199+ | 5.0 star Customer Reviews
SILVER
In Review
In the last blog post: Silver and Gold's Price Movement Depends on 'The Fed' the outlook commentary and chart below was posted for silver.
|
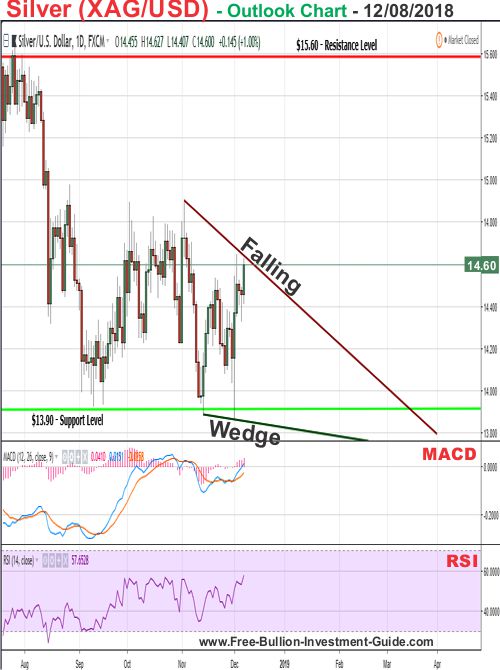
In Silver Outlook chart below, it has formed a 'Falling Wedge' pattern. In all honesty, silver looks like it could break it in the next day or two, which it could, but whenever it breaks it and confirms the pattern, the overall expectation of silver at this time is for it to continue to test the $13.90 support level (shown) and the $13.60 support level (not shown). |
Silver - Review - continued
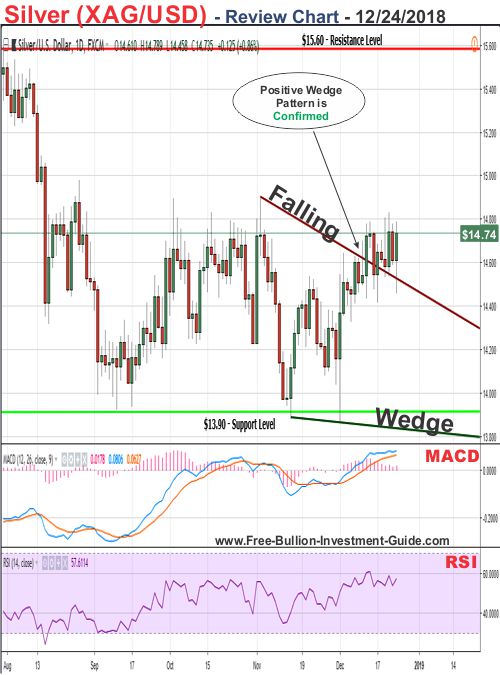
In the silver 'Review' chart below, you can see that silver confirmed the positive 'Falling Wedge' pattern, shortly after, the 'Outlook' chart, above, from the last blog post, was posted.
However, silver did not fall in price as I predicted, instead it has mostly moved sideways over the last few weeks.
Silver's lack of downward movement, after the Fed's interest rate hike, which has been mostly due to the uncertainty in the markets as investors and speculators stash some of their money in safe havens in the recent volatile market.
Silver - Outlook
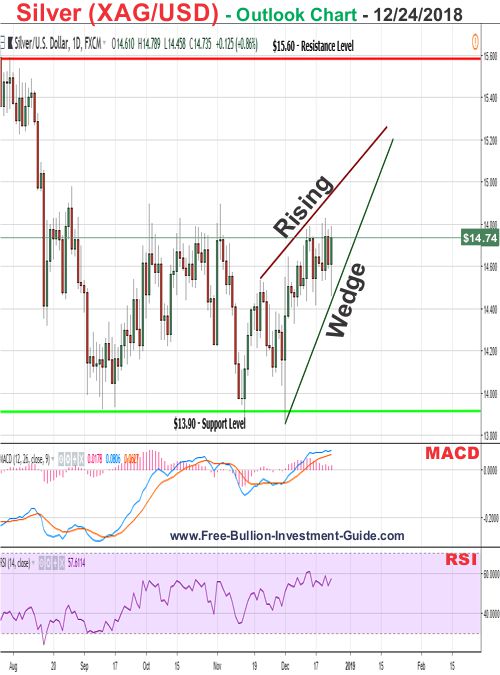
In silver's 'Outlook' chart below, the precious metal has formed a 'Rising Wedge' pattern.
The pattern is a negative pattern, so it's expected to break and confirm it, to the downside, sometime in the near future.
However, from the way silver and gold have been moving lately, silver could easily climb up inside the pattern before it confirms it.
Time will tell.
Charts provided courtesy of TradingView.com
Silver's Price Resistance &
Support Levels
Silver's Resistance Levels
$15.60
$15.00
Silver's Support Levels
$14.20
$13.90
GOLD
In Review
The following chart and commentary was posted in gold's last .
|
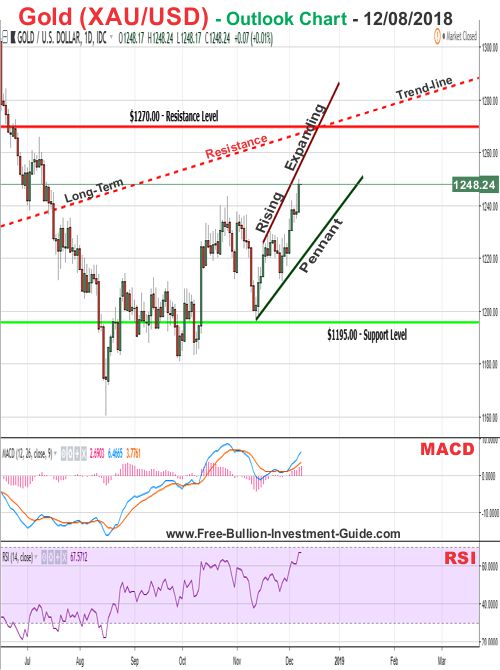
In Gold's 'Outlook' chart below, a negative 'Rising Expanding Wedge' has formed. How long gold trades inside the negative pattern is unknown, most likely up until the Federal Reserve's meeting on December 19th, before confirms the pattern to the downside. |
Gold - Review - continued
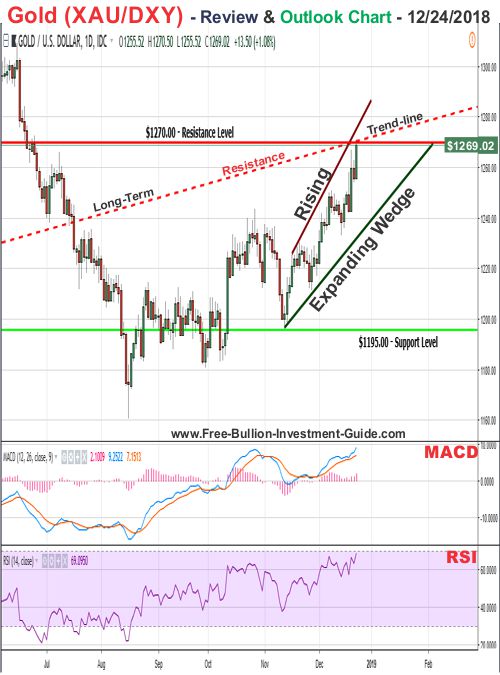
This week, Gold's 'Review and Outlook' chart are in one chart (below) because gold hasn't broken the 'Rising Expanding Wedge' in the chart (above) instead, gold has continued to climb up inside the pattern, due to all the unsettled markets.
Gold - Outlook
For Gold's outlook chart below, the precious metal has managed to climb up to its 'Long-Term Resistance Trend-line at the $1270 price level.
The Long-Term Resistance Trend-line used to be a major support level for gold until it broke it, last July, however, now this Trend-line is a major resistance level for gold, and it should be hard for it to break it.
If it does break through the Trend-line it will be a good sign for gold but, the Expanding Rising Wedge is still intact, and looming over gold's price.
So, as long as the negative Rising Expanding Wedge pattern is relevant, and by assessing the chart (below) using Technical Analysis, the price of gold is expected to confirm it by falling below the wedge's lower trend-line, sometime in the near future.
Charts provided courtesy of TradingView.com
Gold's Price Resistance and
Support Levels
Gold's Resistance Levels
$1310.00
$1270.00
Gold's Support Levels
$1195.00
$1120.00
$1045.00
Thank You for Your Time.
Take Care & God Bless,
Steve
|
Investment/Information Disclaimer: All content provided by the Free-Bullion-Investment-Guide.com is for informational purposes only. The comments on this blog should not be construed in any manner whatsoever as recommendations to buy or sell any asset(s) or any other financial instrument at any time. The Free-Bullion-Investment-Guide.com is not liable for any losses, injuries, or damages from the display or use of this information. These terms and conditions of use are subject to change at anytime and without notice. |
'Click Here' see all of the prior Blog posts,
Thank You for Your Time!
Return from this Guide's Latest Blog Post
|
Support this Guide & Paypal Thank You for Your Support |
|
|
 | |||||
Free Bullion Investment Guide
Keep this Guide Online
& Paypal
Thank You for
Your Support
Search the Guide
| search engine by freefind | advanced |

Daily
Newsletter
Mintages
for
2024
Gold & Silver Mexican Libertad
|
Gold Libertads |
Chinese Gold Coin Group Co.
& Chinese Bullion
2025
Gold & Silver Chinese Panda
|
Silver Panda |
Help Us Expand our Audience by forwarding our link
www.free-bullion-investment-guide.com.
Thank You!
March's

All Articles were Originally Posted on the Homepage


