Has Gold and Silver Hit Bottom Yet?
Review and Outlook for the U.S. Dollar, Silver, and Gold
Originally Posted on 8/19/2018 @ 6:45 pm EDT
Last Edited on 8/20/2018 @ 10:20 am EDT
by Steven Warrenfeltz
Subscribe to this Blog
Hello,
Thank you for visiting the Free-Bullion-Investment-Guide, every visit you make is greatly appreciated.
Before we get to this Review & Outlook, below are some of the Best Bullion Market-Related News articles that were taken from this guide's home page, over the last few weeks.

Household Debt And Credit Report: Up by $82B in Q2 - Advisor Perspectives
If Gold isn’t Money, why do Central Banks have tons of it & keep Buying more? - Commodity Trade Mantra
Gold Will Fight Back Dollar for Haven Status, Sprott Says - Bloomberg
With Investors Away, Collectors Play - Numismatic News
Video: How One Deleted Scene Turns Star Wars into a Struggle against Socialism - Foundation for Economic Education
Currencies Continue Trading In A False Paradigm - Advancing Time
US Debt Sales To Surge: Treasury Raises 2018 Borrowing Need To $1.33 Trillion - Zero Hedge
‘Too Little Too Late’: Bankruptcy Booms Among Older Americans - The New York Times
Get Ready for a Massive Government Spending Spree - Nextgov
United States Mint lifts the curtain on designs for the 2019 America the Beautiful Quarters Program - Mint News Blog
Best of the Week for
Gold NanoParticle Cancer Research
Gold Nanoparticle Cancer Research Report #9 - Free Bullion Investment Guide
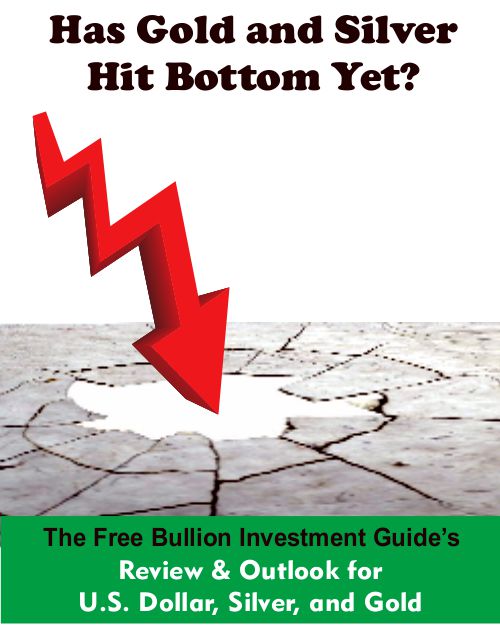
For the last several weeks, I've been reading headline after headline from those who analyze the gold and silver markets that the precious metals have hit bottom.
Then, shortly thereafter, I'd watch the price of gold and silver fall again and hitting a new bottom.
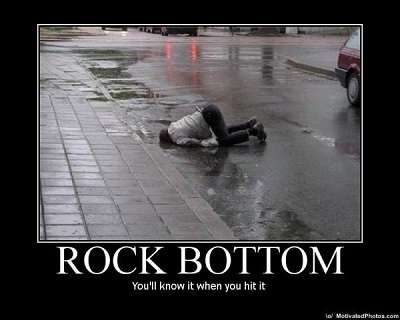
Fact is, nobody, knows when or at what price silver and gold will hit bottom, the precious metals may have just found it in their latest lows, or they may not find it for another month, nobody really knows.
In addition, unlike the poor soul in the photo, it's doubtful we'll know it when gold and silver have hit bottom.
At this time, the best thing that those of us who analyze these markets can do for you is to show you where the support levels are for gold and silver, watch how they move hereafter, and go from there.
Those who state that we've hit a bottom in either gold or silver are simply trying to 'Catch a Falling Knife.'
Review & Outlook
|
All the charts on this blog are Daily Charts unless noted otherwise.
US DOLLAR
In Review
In the last outlook for the U.S. Dollar, the following commentary and outlook was posted:
For the U.S. Dollar's outlook, more of the same is expected, basically an overall sideways move with violent moves to the up and downside.
Over the last week, traders seemed to be at a tug-o-war.
On one side is the Federal Reserve stating that they expect to continue to raise interest rates and on the other side is the President, stating that he's not happy with the interest rate hikes.
Ultimately, the market will decide how the dollar moves, and now it seems indecisive or sideways.
However, sooner or later we should expect to see the 'Rising Expanding Wedge' to be confirmed to the downside.
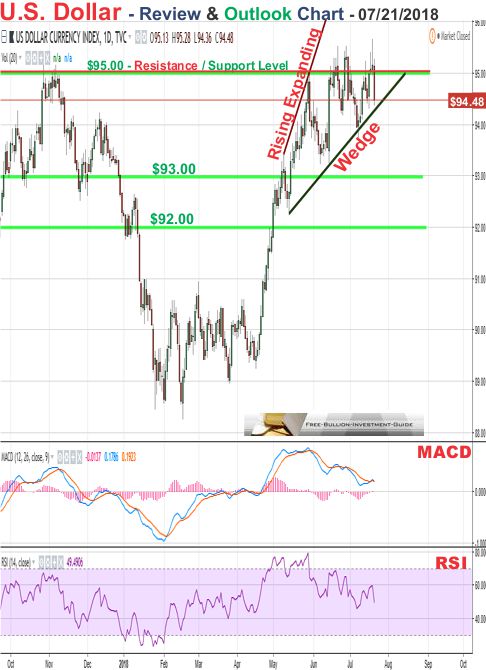
U.S. Dollar - In Review - continued
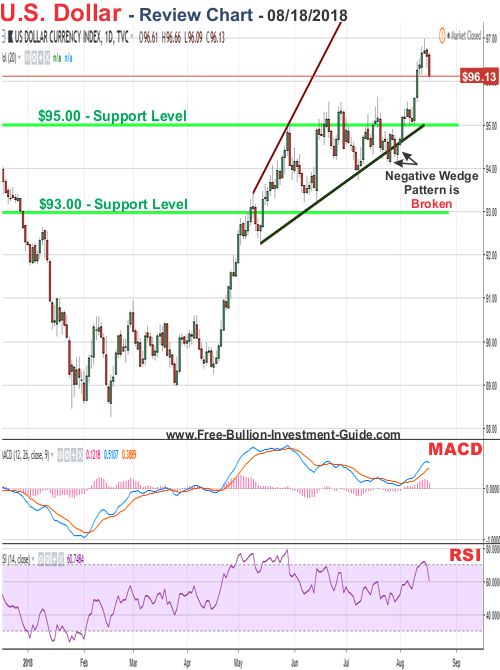
By comparing the chart above with this week's review chart (below), you can see that the price of the U.S. Dollar moved sideways the week after I wrote the last post, and in doing so it broke the broad Rising Expanding Wedge.
I wrote 'broke' instead of 'confirmed' because had the price confirmed the pattern, it would have fallen, but that didn't happen.
Instead, the price of the dollar rose, and in doing so it rose above the $95.00 Resistance/Support level, making it into a solid support level.
U.S. Dollar - Outlook
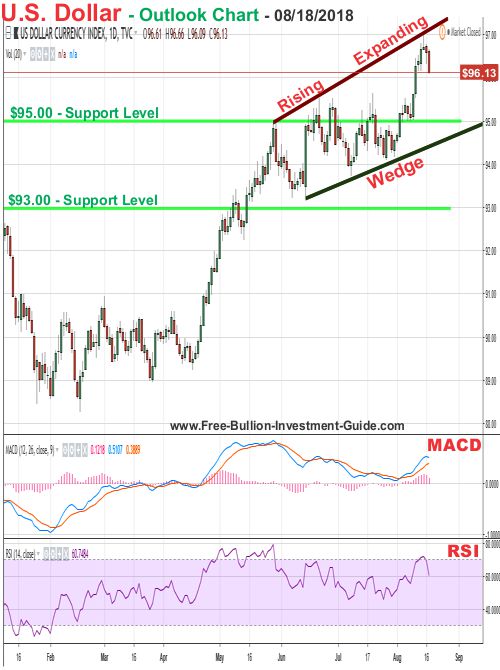
For the U.S. Dollar's outlook, its price is still trading inside a broad 'Rising Expanding Wedge' pattern.
However, it doesn't seem like it will be confirming it, by falling below it, anytime soon.
The dollar has been on a constant rise, and depending on what economic data comes out in the next several weeks, it looks like the Federal Reserve may raise Interest Rates again.
As long as Interest Rates rise, we will most certainly see the U.S. Dollar rise, and by seeing what the market expects from 'The Fed,' here, a rise in Interest Rates will most likely happen at the next Federal Reserve meeting on Sept 25-26.
So for the weeks to come, I expect to see the U.S. Dollar continue to move inside the broad pattern.
Overall, the dollar looks like we may see a pullback in the immediate future, but it's doubtful that it will be enough to confirm the pattern, and it will most likely bounce back and move higher, in the long run.
Charts provided courtesy of TradingView.com
U.S. Dollar's Price Resistance and Support Levels
U.S. Dollar's Resistance Levels
$96.00
U.S. Dollar's Support Levels
$95.00
$93.00
For Bitcoin (BTC/USD) and Stellar (XLM/USD) Analysis
SILVER
In Review
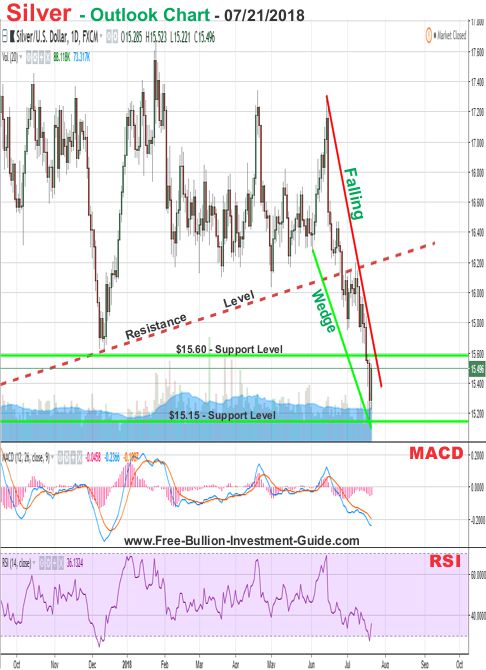
Four weeks ago, the outlook below was written for silver.
In Silver's outlook chart below, I've adjusted the bottom trend-line of the steep 'Falling Wedge.'
I kept the pattern in the chart because as long as it can be drawn, it is relevant.
However, right now, silver continually seems to be finding new lows and although some kind of bounce is expected at its price, it is unknown whether or not it will have legs. Time will tell.
Silver - In Review - continued
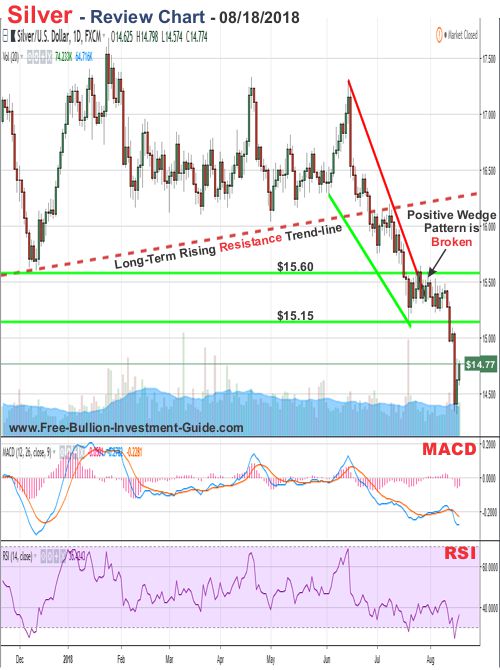
In silver's review chart below, you can see that the price of silver broke the 'Falling Wedge,' but it didn't confirm it.
Had it confirmed that positive 'Falling Wedge' pattern, the price would have moved up, but instead, it moved sideways for a little while, then it fell in price again.
Silver - Outlook
Like I mentioned in the introduction,
"At this time, the best thing that those of us who analyze these markets can do for you is to show you where the support levels are for gold and silver, watch how they move hereafter, and go from there."
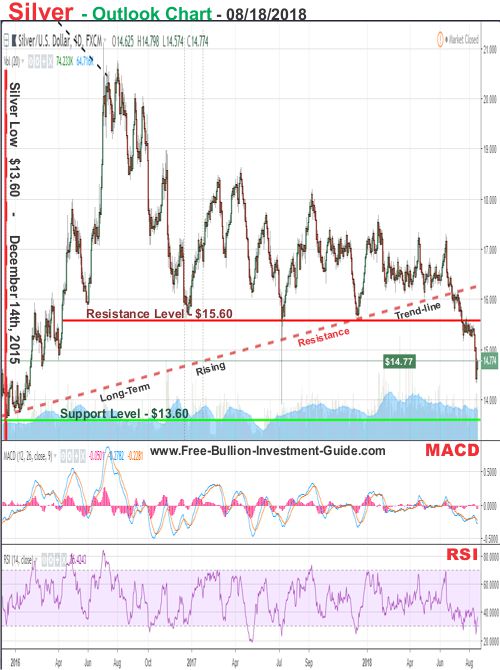
Unfortunately, for Silver, it has fallen through most of its previous strong lows.
Currently, the strongest support level that still stands for silver dates back to December 14, 2015, when silver hit a low of $13.60.
For silver's outlook, there are no technical patterns to be found when the price is falling, the best thing to do is stand back and wait for it to stop.
There are other strong support levels, for silver, under the $13.60 price level, but for now, we'll simply have to wait and see if the $13.60 support level holds.
Charts provided courtesy of TradingView.com
Silver's Price Resistance &
Support Levels
Silver's Resistance Levels
$15.60
$15.15
Silver's Support Levels
$13.60
For Bitcoin (BTC/USD) and Stellar (XLM/USD) Analysis
GOLD
In Review
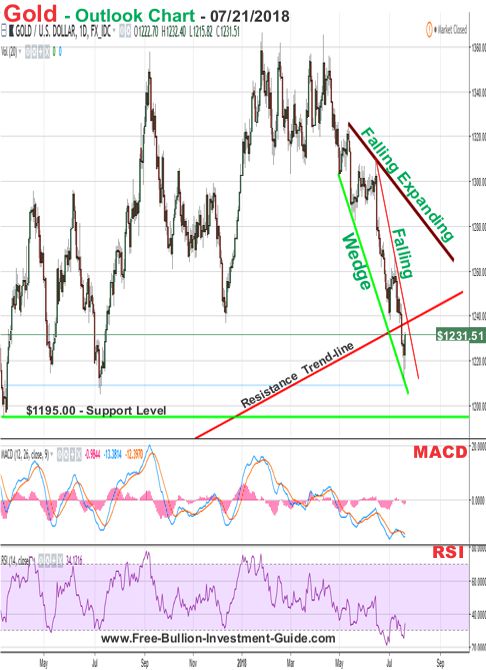
The following chart and commentary was posted four weeks ago, in gold's last outlook.
In gold's outlook chart below, you can see what I mentioned in the review above, that gold now has two positive patterns in its price chart.
Obviously, gold is expected to break above the narrow 'Falling Wedge' before it would break the positive 'Falling Expanding Wedge.'
For the gold's outlook, it is expected to break the 'Falling Wedge' sometime in the next week or so.
But, even if gold breaks the 'Falling Wedge,' by the looks of things, the precious metal will continue to fall in search of a bottom.
Gold - In Review - continued
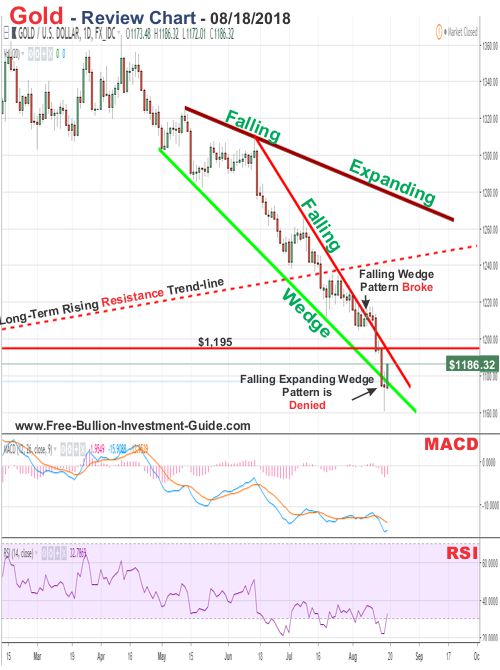
As you can see in the Gold review chart below, both of the positive technical patterns in Gold's price chart failed their expected outcomes.
The 'Falling Wedge' broke, but its pattern expectations of moving higher were not confirmed, plus the broad 'Falling Expanding Wedge' pattern was denied when the price of gold fell below the bottom trend-line of the positive wedge.
The $1,195 price level, was a support level, but now that the price of gold fell through it, it has become a resistance level for gold.
Gold - Outlook
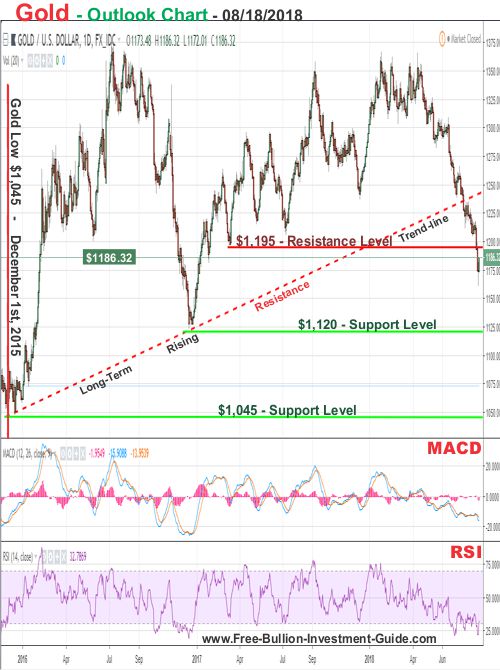
For gold's outlook, more downside is expected for the precious metal, we can expect some bounces up, but its overall expectation is for it to move lower at this time.
In the outlook chart below, I've indicated two strong support price levels that may stop gold's fall in price.
Those price levels are the $1,120 price level and the $1,045 price level, hopefully one of those price levels will hold, time will tell.
The important thing to remember about gold and silver is that they almost always move opposite of the U.S. Dollar, and if we continue to see Interest Rate hikes we should also continue to see the dollar move higher, and gold and silver move lower.
But, as we saw in 2008, the constant rise of interest rates will put more strains on the economy, especially on those who have debt, and sooner or later that strain on the market will break, which will cause all markets to fall.
In addition, even though gold and silver will most likely fall with the other markets when this happens, they will also be the first to recover after traders flock to them because of their 'enduring' safe haven status.
This is just something to remember while gold (and silver) fall in price, searching for a bottom.
Charts provided courtesy of TradingView.com
Gold's Price Resistance and
Support Levels
Gold's Resistance Levels
$1225.00
$1195.00
Gold's Support Levels
$1120.00
$1045.00
Thank You for Your Time.
Have a Great Week and God Bless,
Steve
For Bitcoin (BTC/USD) and Stellar (XLM/USD) Analysis
'Click Here' see all of the prior Blog posts,
Thank You for Your Time!
|
Investment/Information Disclaimer: All content provided by the Free-Bullion-Investment-Guide.com is for informational purposes only. The comments on this blog should not be construed in any manner whatsoever as recommendations to buy or sell any asset(s) or any other financial instrument at any time. The Free-Bullion-Investment-Guide.com is not liable for any losses, injuries, or damages from the display or use of this information. These terms and conditions of use are subject to change at anytime and without notice. |
Return from this Guide's Latest Blog Post
|
Support this Guide & Paypal Thank You for Your Support |
|
|
 | |||||
This website is best viewed on a desktop computer.
Keep this Guide Online
& Paypal
Thank You for
Your Support
with Feedly
Search the Guide
| search engine by freefind | advanced |
Premium Canadian Bullion
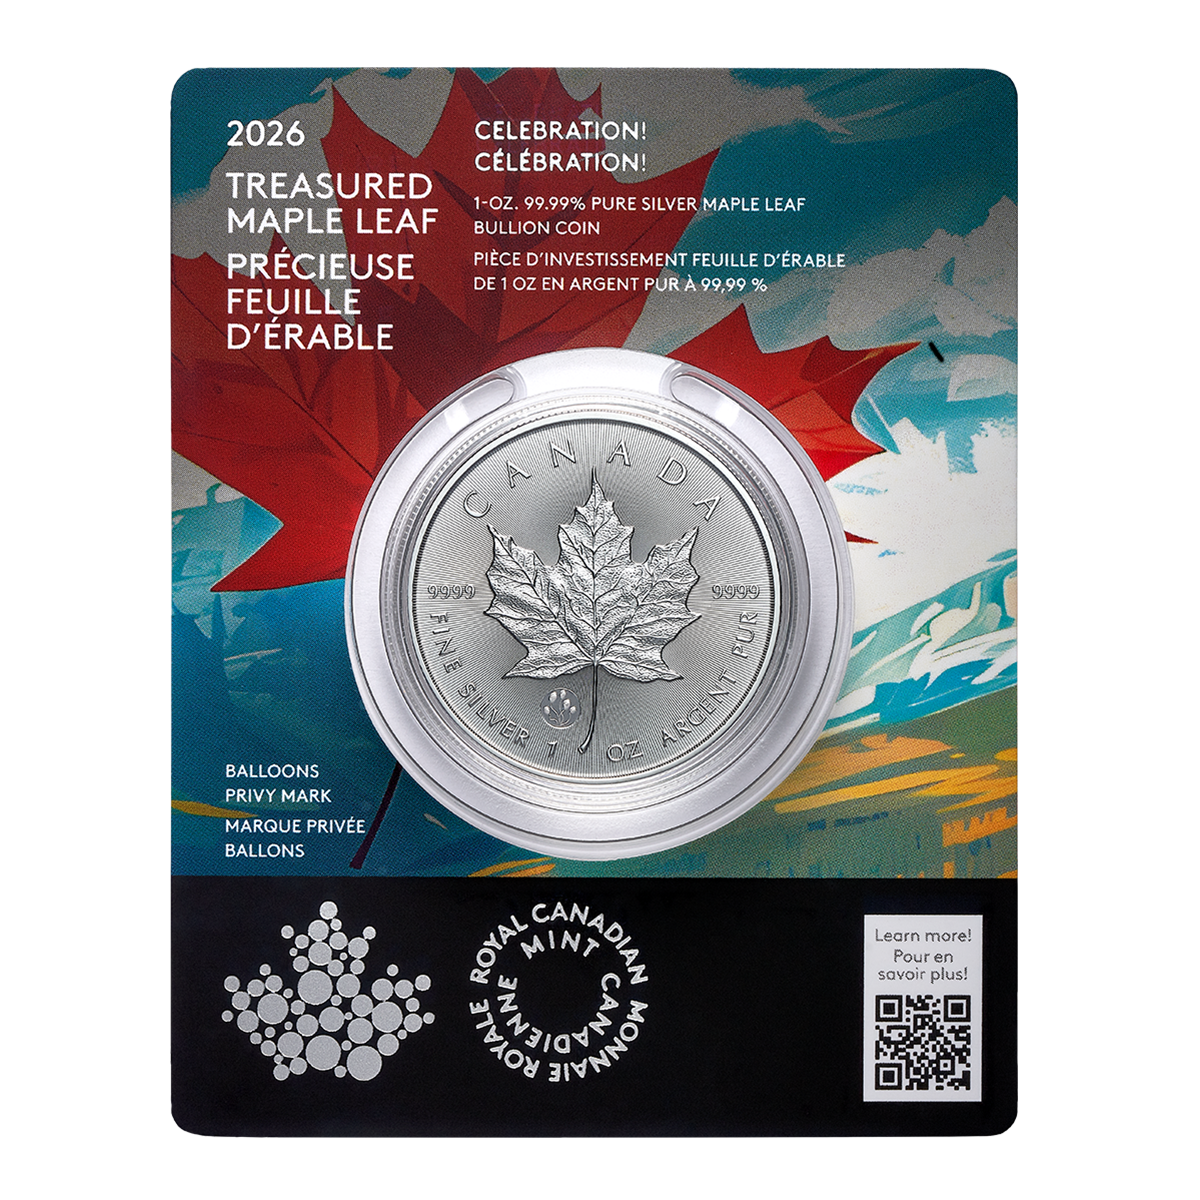
Give a lasting gift of the iconic Silver Maple Leaf bullion coin [More]
Free Shipping on Orders over $100 (CDN/USA)
or
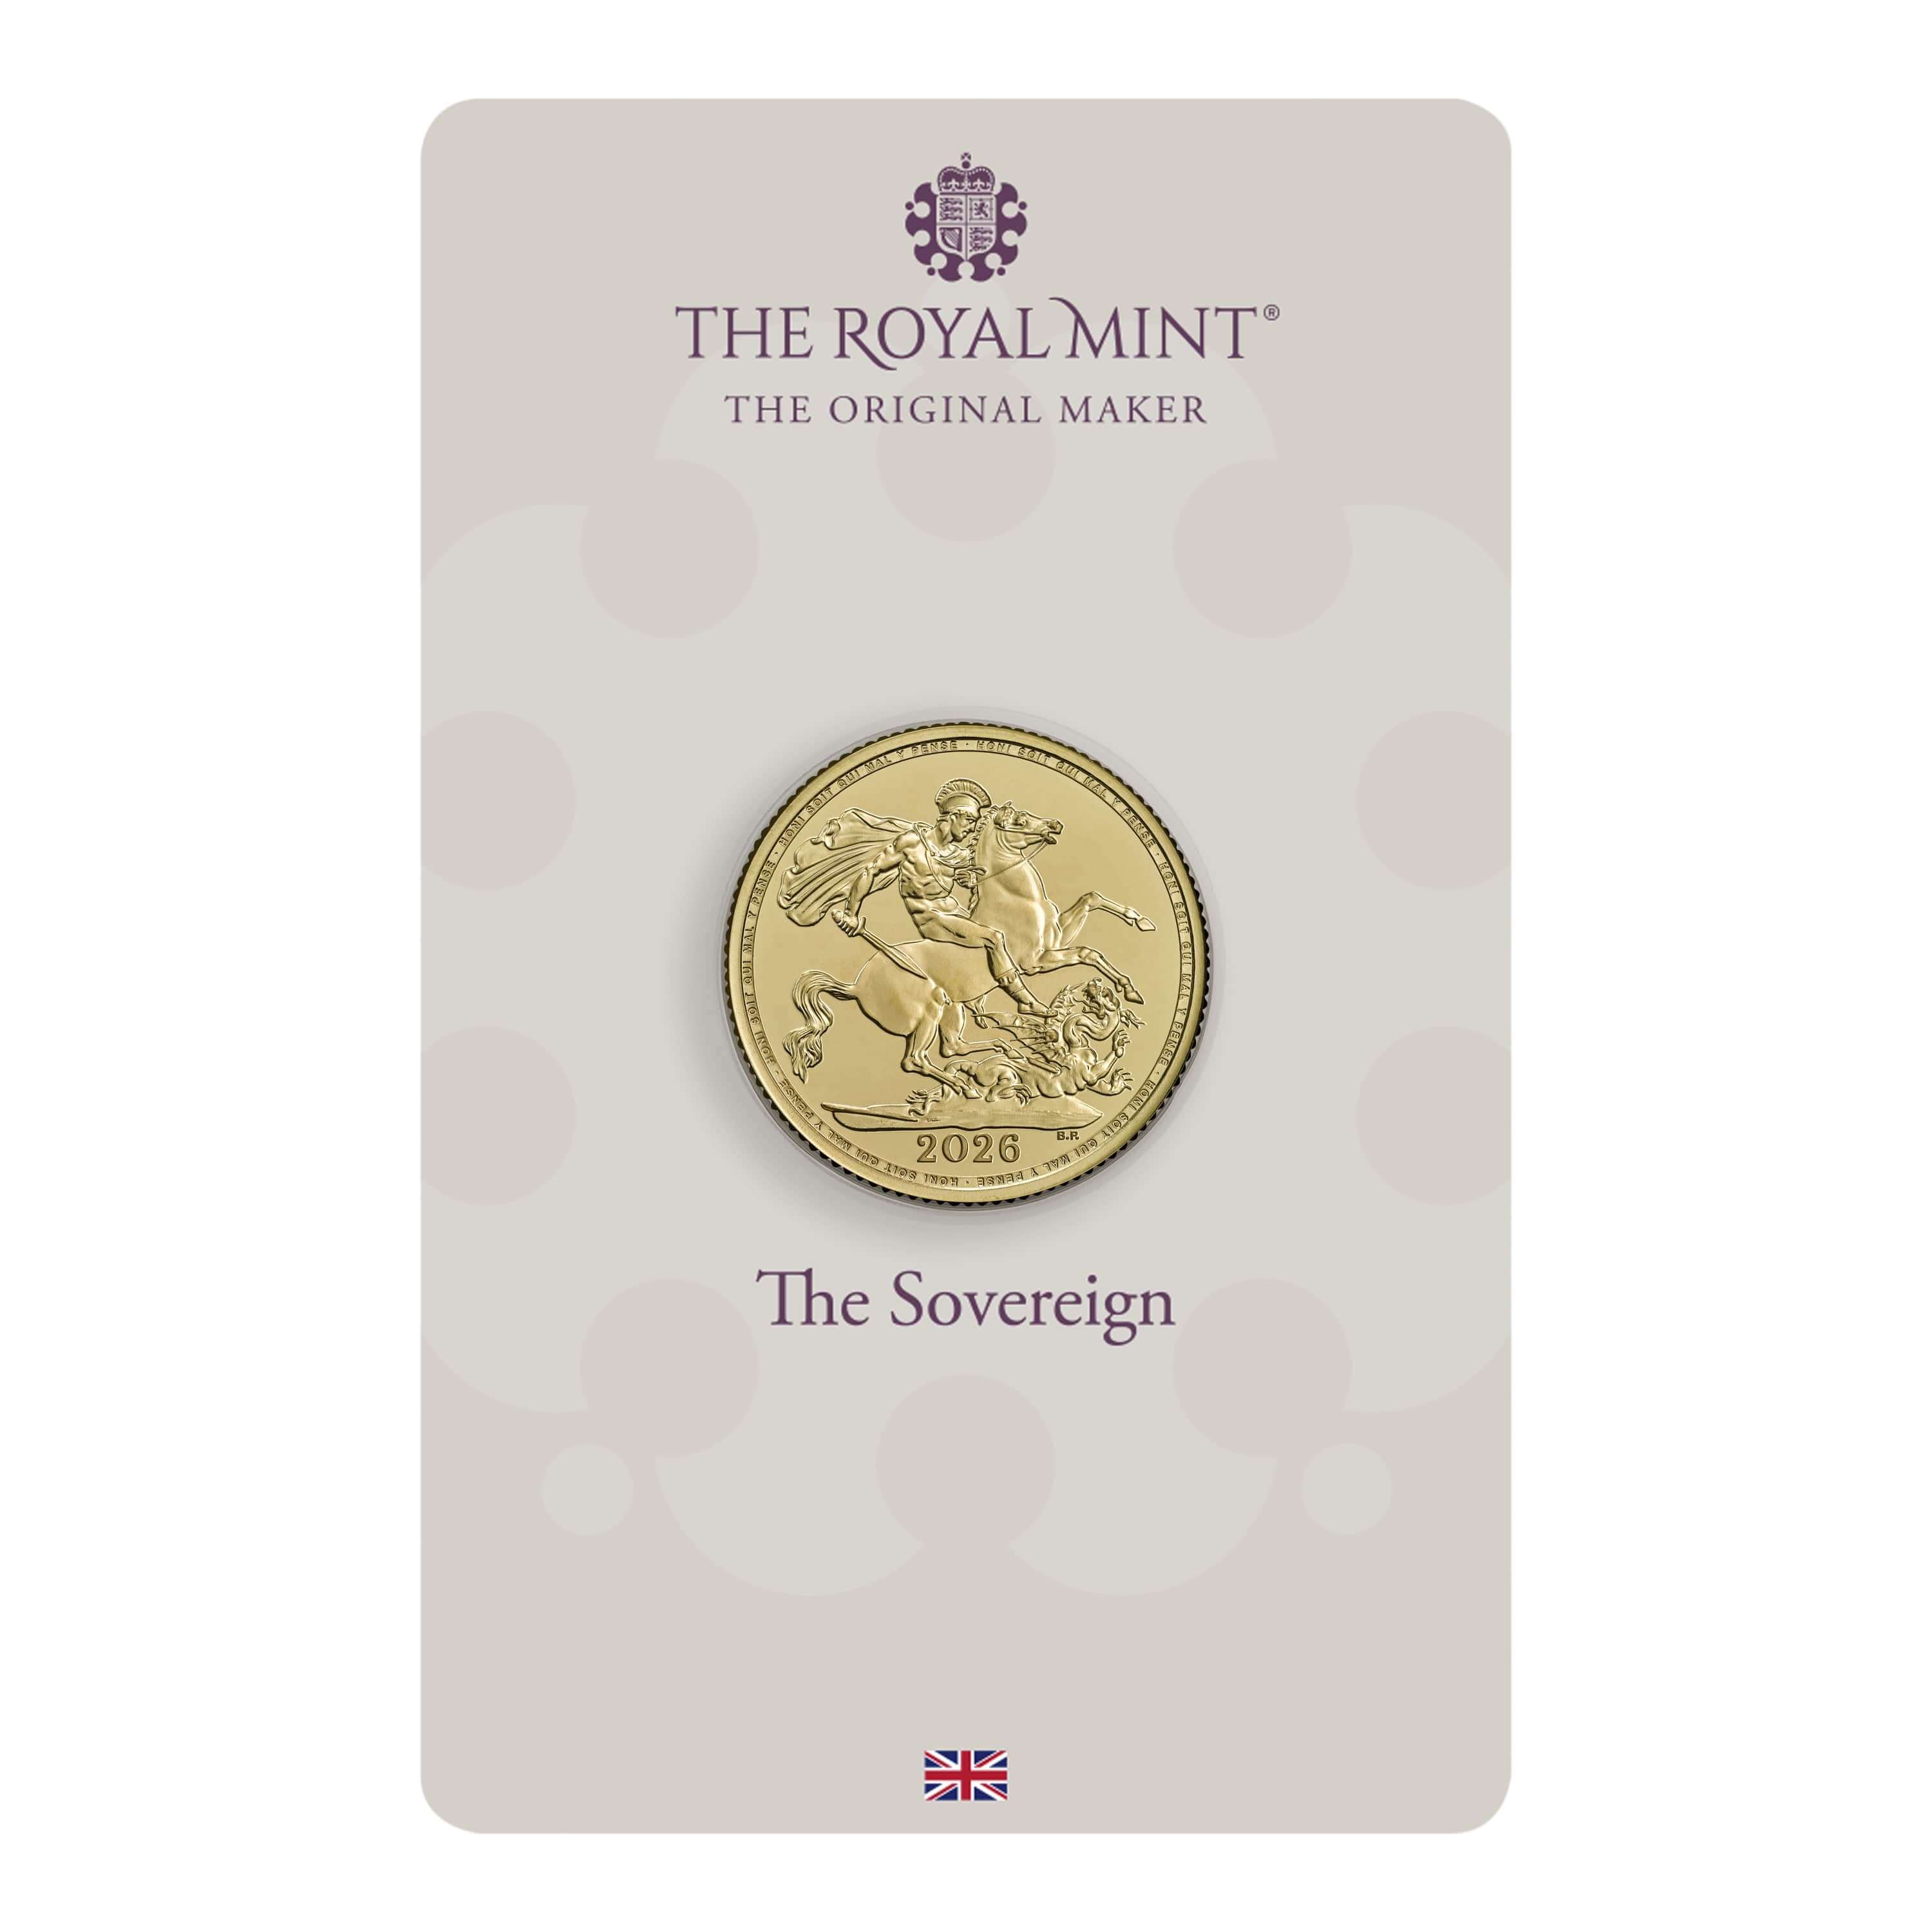
From the U.K. Royal Mint

Daily
Newsletter
Updated Mintages for
American Gold Buffalo
American Gold Eagle
American Silver Eagle
2024 & 2025
Jerusalem of Gold Bullion
Coin photos
(bottom of page)
Mintages
for
2024
Gold & Silver Mexican Libertad
|
Gold Libertads |
Chinese Gold Coin Group Co.
& Chinese Bullion
Help Us Expand our Audience by forwarding our link
www.free-bullion-investment-guide.com.
Thank You!
Last Month's

In No Particular Order
January 2026
All Articles were Originally Posted on the Homepage
