Gold and Silver 2016
Bull Market Wins
End of Year Review and Outlook
Originally Posted on 01/08/2017 @4:34pm
Gold & Silver - Bull Market Wins
Hello, I hope you had a very Merry Christmas and a Safe and Happy New Year.
A lot of what was posted in the last blog post - seen here, has happened or is in the process of happening.
One thing that I was not sure of in mid-December was; How will Gold and Silver end the year?
My hypothesis was that if the precious metals ended the year on a positive note; then it would be a good sign that gold and silver bulls had won 2016 and their bear markets have been broken.
But, if gold and silver ended the year in the negative; it would've been a definite sign that Gold and Silver’s bear markets were still intact.
In the gold and silver charts from the last blog post, I showed the positive technical patterns that had formed in their charts, but I also indicated that Gold and Silver might end the year in the negative because traders sell their losing assets to offset their annual Capital Gains taxes.
Traders sold at the end of the year, but not enough for gold and silver to end the year in the negative; Gold ended the year up 8.5%, and Silver ended 2016 up 14.8%.
By ending the year on a positive note, Gold and Silver proved that 2016 was a Bull Market for both assets, although I hope we don’t see another year like this one – it's still considered a bull market; now we’ll have to see what 2017 has in store.
This week, I want to share with you how the patterns that have been building in the charts, have played out, and what the charts are indicating for the future of Gold, Silver and the U.S. Dollar.
GOLD
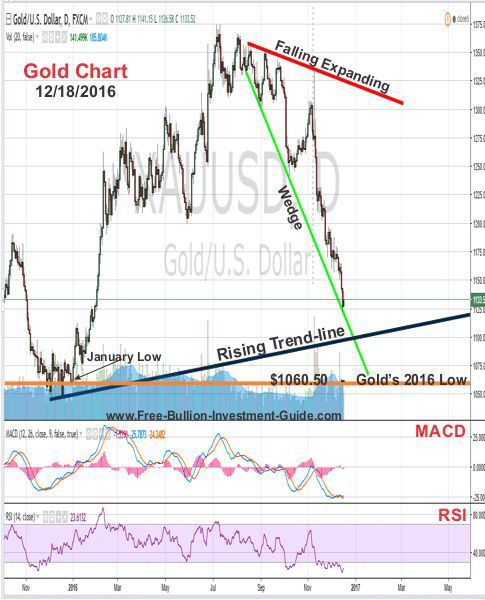
The chart below is from Dec. 19’s blog post, in it, I have indicated an expanding falling wedge, gold's 2016’s low, and gold’s last rising trend-line that begins from its 2015 low of $1045.
Charts provided courtesy of TradingView.com
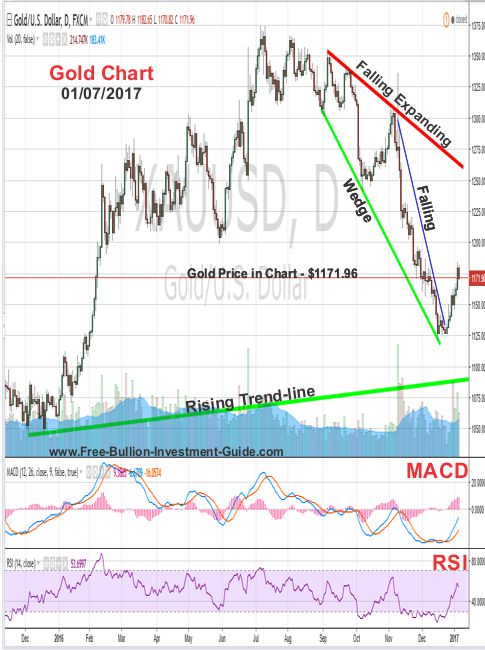
In the chart below, I’ve adjusted the expanding falling wedge to give a better representation of when the wedge started to fall.
In addition, I kept a falling wedge in the chart that I added around Christmas; it was an indication that the price was going to correct and start to move in the opposite direction.
The question now is; Now that Gold and Silver have changed directions - how much will it turn up?
If you want future prices, I'm not that guy - I'm not a fortune teller.
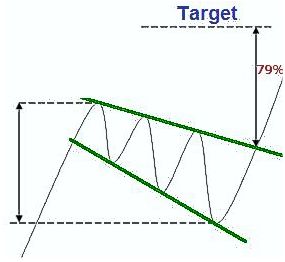
However, what I can offer you is a perspective, in the chart above I’ve kept the falling expanding wedge.
This is a bullish
indicator, and as you can see in the
chart below, it could be very bullish for gold.
If gold does move in this way, don't expect it to do it in one shot, in a healthy bull market, every move up should have periods of consolidation or profit taking.
However, I don't want to come across as too optimistic. One thing about this market that we all need to remember is that the Free Market doesn't govern it, the Federal Reserve does.
Note: Click the chart above for Forex-Central's definition of the 'Falling Expanding Wedge' also known as a 'Descending Broadening Wedge.'
Gold's Price Resistance &
Support Levels
One very important support/resistance level to be aware of is the $1180.
For gold to continue to move upward, it will need to break above this level and stay above it. In the week to come, we may see some more consolidation at the level, before it decides which way it will move.
Gold's Resistance Level
$1225.00
$1200.00
$1180.00
Gold's Support Levels
$1120.00
$1100.00
$1060.50
SILVER
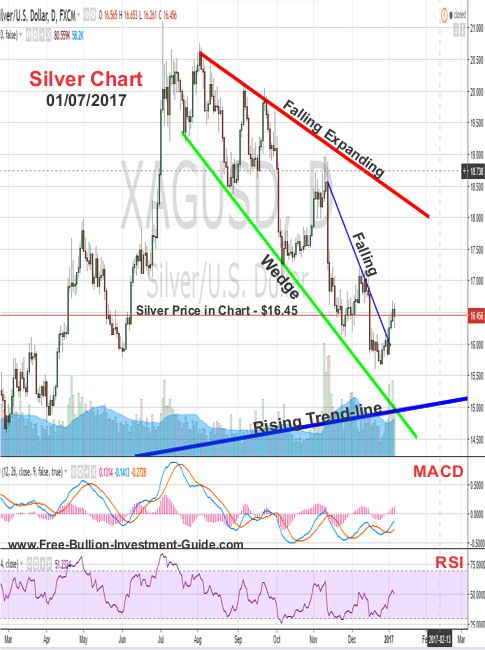
In the Silver chart below, it displays the same falling expanding wedge as seen in gold's chart above.
Also, it too had a falling wedge form (blue line), and like gold, silver reversed direction shortly after Christmas, confirming the falling wedge’s technical pattern.
On December 19’s post, the rising trend-line was indicated at the bottom of the chart.
Furthermore, like gold, silver’s expanding falling wedge is a bullish indicator.
Traditionally, silver leads gold in its long-term trade, so if it breaks above its expanding falling wedge, expect gold to do the same.
Charts provided courtesy of TradingView.com
Silver's Price Resistance and
Support Levels
Silver's Resistance Level
$17.10
$16.90
$16.65
Silver's Support Level
$15.60
$15.10
US DOLLAR
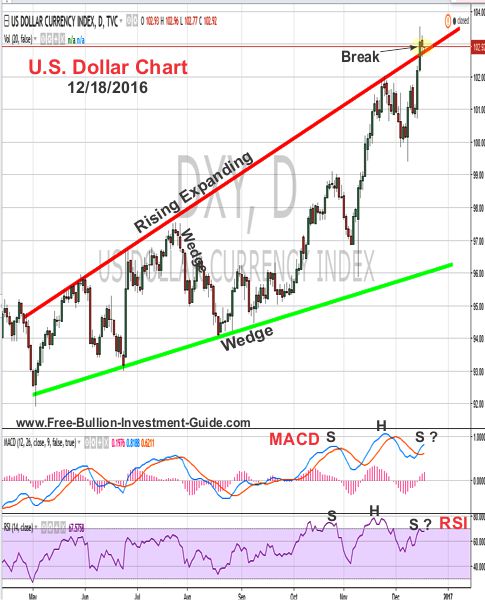
The chart below is from the last blog post, in it, the U.S. Dollar broke above its rising expanding wedge, which as indicated by the chart to the right, it wasn’t a good sign for those expecting to see the Dollar move higher.
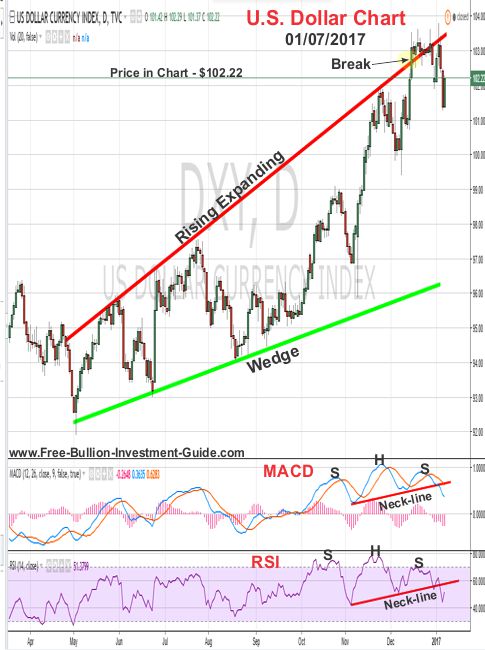
Also indicated in the chart below are the head and shoulders
patterns forming in the U.S. Dollar’s MACD & RSI (lower indicators), both of which have played
out as expected and broken below their neck-lines.
(continued…)
Charts provided courtesy of TradingView.com
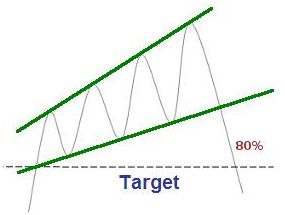
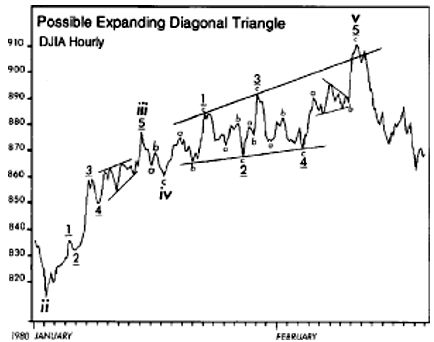
Furthermore, the expanding rising wedge in the U.S. dollar chart is a negative sign for the dollar.
I have included under the U.S. dollar chart below an example chart of what the future may have in store for the U.S. Dollar.
Note: Click the chart above for Forex-Central's definition of the Rising Expanding Wedge or 'Ascending Broadening Wedge.'
U.S. Dollar's Price Resistance and Support Levels
U.S. Dollar's Resistance Level
$103.50
$102.90
U.S. Dollar's Support Level
$101.00
$100.20
$99.75
Music
In an early October blog post, in the music section, I wrote about hearing Frank Sinatra the first time in my father’s, best friend’s restaurant in Middleburg, Va. it was called the ‘Coach Stop.’
This weekend, my dad’s friend emailed him an article from 1987 that was in the Washington Post, it describes Middleburg very well and it includes a interview with him and his wife (near the end of the article); I thought I would include it for those who might interested.
Middleburg's Well-Bred Life - Washington Post (1987)
When I was a boy, my father would often tell me this about his friend saying; 'Nothing has been given to him, he's worked very hard for his success.' He also would tell me where Brian got his start in the restaurant industry; McDonald's.
So, this weekend I listened to a 'Crooners' radio station, and as I listened this song came on; – ‘Kissing a Fool’ by George Michael.
It was the first I had heard the song on this station; maybe they played it as a Tribute to a Great Artist or because it fits the genre, either way, it's a great song.
Note: the only version I could find of the official video includes Spanish Sub-titles.
Thank you for your time & God Bless,
Steve
Thank You for Visiting the Free Bullion Investment Guide
This
Guide Gives a Portion of Every Sale to St. Jude Children's Research
Hospital, Please Help Us Give to those who are Battling Cancer
by Supporting our Affiliates
(Every Advertisement on the Guide is from one of our Affiliates)
'Click Here' see all of the prior Blog posts,
Thank You for Your Time!
|
Support this Guide & Paypal Thank You for Your Support |
|
|
 | |||||
Free Bullion Investment Guide
Keep this Guide Online
& Paypal
Thank You for
Your Support
Search the Guide
| search engine by freefind | advanced |

Daily
Newsletter
Mintages
for
2024
Gold & Silver Mexican Libertad
|
Gold Libertads |
Chinese Gold Coin Group Co.
& Chinese Bullion
2025
Gold & Silver Chinese Panda
|
Silver Panda |
Help Us Expand our Audience by forwarding our link
www.free-bullion-investment-guide.com.
Thank You!
March's

All Articles were Originally Posted on the Homepage


