Fundamentals are Channeling
the Precious Metals
in their short-term trade
Precious Metals Review and Outlook from
9/04 thru 9/22/2017
Originally Posted on 09/18/2017 @ 2:47 pm
by Steven Warrenfeltz
Subscribe to this Blog

Hello,
I hope you've been well, and Thank you for visiting the Free-Bullion-Investment-Guide's latest blog post, before we get to the precious metals review and outlook, below are some of the Best Bullion Market-Related News articles that were taken from this guide's home page.

CFTC Files Complaint Against Monex Alleging $290 Million Fraud - CoinWeek
Monex: Will the CFTC End Retail Bullion Leverage? - CoinWeek
VIDEO : Perth Mint unveils Australia’s official bullion coin program for 2018 - Perth Mint Blog
Louise Yamada's stock chart models show we are way overdue for a big correction - CNBC
The ‘Sum of All Fears’ Fuels Gold Rally - Bloomberg
Record Incomes Mean Little in Debt Era - Bloomberg
AUDIO : Autumn Storms: Watch for Signs and Prepare - Financial Sense
INFOGRAPHIC : Visualizing the Real Value of the Minimum Wage - Visual Capitalist
Best of the Week for Gold NanoParticle Cancer Research
GOLD NANOPARTICLE : CANCER RESEARCH : The Gold Standard in Cancer Treatment - LabrootsGOLD NANOPARTICLE ~ CANCER RESEARCH: Test strips for cancer detection get upgraded with nanoparticle bling - PHYS.ORG

For the last two weeks, Fundamentals have been driving investors and traders to safe-haven assets like the precious metals.
These fundamentals have included, the constant threats from North Korea, Mario Draghi giving indications that an end to the ECB's quantitative easing may be sooner than the market thinks, plus natural disasters and the dismal economic news like the August Jobs report and low inflation.
The last two fundamentals have everything to do with how the market perceives what the Federal Reserve will do at their next meeting on September 19-20th.
Had the August Jobs report signaled more growth and if inflation was higher, then the market would be expecting to hear Janet Yellen tell all of us why they raised rates again, but that isn't what the market expects.
What the market is expecting to hear from the Federal Reserve after this meeting is how and when they are going to start reducing their $4.5 Trillion balance sheet.
It is unclear how the announcement will affect safe haven assets because we are in uncharted waters; quantitative easing is the invention of central bankers and politicians who are afraid of the truest principal of the Free Market a.k.a. Capitalism: that nothing is too big to fail.
Over the last several weeks the fundamentals have helped move the precious metals higher, in an ascending channels, which I first started to notice last week.
Last week, I was unable to post a blog post because I was sick, but before I really started to feel like crap, I finished the charts for the post, some of which will be included in this post.
For the week to come, it is unclear how much fundamentals are going to continue to move the precious metals, a few of the ascending channels in last weeks (intended) post have already broken and the negative patterns that have been on this guide's charts, since last month, have been confirmed.
It is for this reason, that I will be starting this week's technical analysis in an unusual order, this week's analysis will be in this order; Platinum and Palladium, then the U.S. Dollar, Gold, and Silver.
Note: this order of analysis is only intended for this week.
Platinum
In Review
To start off, below is the chart and commentary posted two weeks ago.

For the immediate future, gold, silver, and platinum charts are all indicating that we are witnessing a tug of war between fundamentals and technical analysis.
Fundamentals are helping the price of the precious metal move higher, but the 'Rising Expanding Wedge' in Platinum's chart is looming over the price in a negative way.
Time will ultimately judge the outcome.

In Review - continued
As I previously mentioned in the intro, I was able to complete the charts for last week's post before I got more sick, below is the chart that I made up for platinum.
In the chart, you can see that the 'Rising Expanding Wedge' is still in the chart, but an Ascending Channel was also identified in the chart.
(continued...)
 Platinum Price Chart")
In Review - continued
The next chart below shows you what happened to the 'Rising Expanding Wedge' and the Ascending Channel in Platinum's chart, the wedge was confirmed, and the channel was broken.
This is the reason why I started with Platinum in this week's 'Review
and Outlook which is because as we move through the charts you'll see a similar theme to the platinum chart above, which will probably see an outcome like the platinum chart below.

Platinum - This Week's Outlook
In platinum's outlook chart below, no clear patterns could be found, in addition, although platinum is closing in on a broad support, its MACD and RSI (lower indicators) both show that more downside is probably in its future.
This simply means that although we may see some more pullback in platinum's price this week, it should stop its pullback somewhere inside the support area below.

Charts provided courtesy of TradingView.com
Platinum's Price Resistance and Support Levels
Platinum's Resistance Levels
$1015.00
$990.00
Platinum's Support Levels
$965.00
$935.00
Palladium
In Review
In the blog post from two weeks ago, a chart pattern that was posted for Palladium in the blog was denied, so I wrote the following commentary.
I also posted the chart below so you can understand why I wrote, what I wrote.
Now that Palladium has broken the 'Rising Expanding Wedge, palladium looks like it may try to break through the top of the Ascending Channel.
So, because of palladium's price action, I'm going to take a 'wait and see' stance on the precious metal.
Plus, with the fact that Hurricane Irma is expected to hit the United States sometime in the next 7-days, palladium's price will likely continue to be volatile and very hard to predict.

In Review - continued
Last week, after I reviewed palladium's chart, I found another 'Rising Expanding Wedge,' so had my cold not gotten worse last week, I would have posted the chart below.

In Review - continued
In the chart below, you can see that last week's 'Rising Expanding Wedge' was confirmed.
In addition, palladium's ascending channel is a lot broader than the other precious metals, so it is very doubtful that it will be broken in the near future like the ascending channels in the precious metal charts.
Palladium - This Week's Outlook
No clear patterns have formed in palladium's chart, and like platinum, it too has a broad support level, but the price looks like it may pullback more in the week to come, before it finds support.

Charts provided courtesy of TradingView.com
Palladium's Price Resistance and Support Levels
Palladium's Resistance Levels
$950.00
Palladium's Support Levels
$900.00
US DOLLAR
In Review
Below is the U.S. Dollar's commentary and chart from two week ago.
In the U.S. Dollar's chart, no clear patterns have formed out of last week's move, but the U.S. Dollar's lower indicators (MACD & RSI) look like the price may be ready to move up, bringing it closer to the upper trend-line of the 'Falling Expanding Wedge.'

In Review - continued
In the chart below you can see that the price of the U.S. dollar did not rise, instead it has continued to slowly move sideways in a downward slant.
U.S. Dollar - This Week's Outlook
In this week's U.S. Dollar chart a lot is going on, in addition to the 'Falling Expanding Wedge,' the dollar has also formed a channel, in its case its a 'Descending Channel,' plus an 'Inverse Head and Shoulders' pattern looks like it is forming in the chart.
All the patterns, but the channel, are positive for the U.S. Dollar, but like the channels in this week's precious metals charts, the U.S. Dollar is expected to break its channel sometime in the near future.
In addition, the positive 'Inverse Head and Shoulders' pattern is only implied, but the same pattern is also forming in the U.S. Dollar's MACD and RSI (lower indicators) so it may be confirmed very soon, time will tell.

Charts provided courtesy of TradingView.com
U.S. Dollar's Price Resistance and Support Levels
U.S. Dollar's Resistance Levels
$94.00
$93.00
U.S. Dollar's Support Levels
$91.00
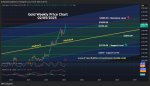
GOLD
In Review
Below is the gold outlook from two weeks ago.
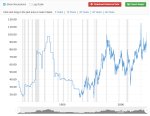
The chart below is expanded to show you the next major resistance level for gold, prices haven't reached this level since after the Brexit vote in late June of 2016.
As you can see in the chart above and below, the price of gold has continued its steep climb in price, but gold's RSI (lower indicator) is trading well in the over-bought territory.
On the other hand, gold's MACD (lower indicator) hasn't moved that high, so we may see some consolidation then another move up, it mostly depends on what happens in the news this week that will determine gold's movement.
However, caution should be in the air for any 'established asset' that rises this high, this fast, meaning that the price of gold is expected to confirm the negative influence of the 'rising expanding wedge' sometime in the future.
Time will tell when that time comes.

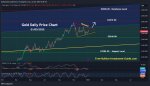
In Review - continued
In the chart below, you can see that the price of gold briefly rose and created a high above the $1350 level, but it did not have the strength to close above that level.
Gold - This Week's Outlook
Gold has formed an 'Ascending Channel,' but the 'Rising Expanding Wedge' still hasn't been denied or confirmed, so it continues to loom over the price of gold, in a negative way.
For the week to come, it looks like gold's chart will look a lot like platinum's 'Broken Ascending Channel' chart, in the platinum section above.
Why?
Take a look at Gold's MACD and RSI (lower indicators), both are in overbought territory and both are indicating that the price has more room to pull back.

Charts provided courtesy of TradingView.com
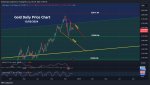
Gold's Price Resistance and
Support Levels
Gold's Resistance Levels
$1380.00
$1350.00
Gold's Support Levels
$1300.00
$1280.00
SILVER
In Review
Below is the silver commentary and chart from this guide's post from two weeks ago.
In the silver chart below, the 'Rising Wedge' pattern has been slightly adjusted, I moved the top trend-line to the next higher high (If you compare the top and bottom chart you can see the difference in the origin of the upper trend-line)
However, I noticed that if I moved the upper and lower trend-lines back to Silver's low (in the chart) that silver's price is in a very narrow ascending channel.
I did not show the ascending channel in the chart below because the 'Rising Wedge' has not been confirmed or denied.
So, we'll see this week if Fundamentals continue to move the metal higher, denying the expectation of negative Rising Wedge pattern, or fall in price confirming it.

In Review - continued
Below is the silver chart from last week, as you can see the rising wedge was denied, but as you will see in the outlook below, that with that wedge's denial the 'Ascending Channel' came into better focus.

Silver - This Week's Outlook
After last week's move in silver, the only pattern that I could identify in silver's charts was an 'Ascending Channel,' but I don't expect it to last.
This isn't necessarily a bad thing, with all the precious metals that have or had a narrow 'Ascending Channel' it simply means that a correction is or was due.
Unlike what you'd expect if a broad 'Ascending Channel' like Palladium's was broken which would mean something in its market had changed for the better or worse.
In addition, Silver's MACD and RSI, lower indicators, look like they have more room to fall in a price correction, however, silver has a broad range of support so we should see the price stop its fall somewhere in this area.

charts provided courtesy of TradingView.com
Silver's Price Resistance &
Support Levels
Silver's Resistance Levels
$18.00
$17.70
Silver's Support Levels
$17.15
$16.15
Thank You for Your Time.
Have a Great Week.
God Bless, Steve
'Click Here' see all of the prior Blog posts,
Thank You for Your Time!
Investment/Information Disclaimer:
All content provided by the Free-Bullion-Investment-Guide.com is for informational purposes only. The comments on this blog should not be construed in any manner whatsoever as recommendations to buy or sell any asset(s) or any other financial instrument at any time. The Free-Bullion-Investment-Guide.com is not liable for any losses, injuries, or damages from the display or use of this information. These terms and conditions of use are subject to change at anytime and without notice.
|
Support this Guide & Paypal Thank You for Your Support |
|
|
 | |||||
Free Bullion Investment Guide

Recent Articles
-
Newsletter of the Free Bullion Investment Guide - April 2025
Apr 05, 25 08:19 PM
 The April 2025 newsletter of the Free Bullion Investment Guide provides the latest updates, fundamental and technical gold and silver market analysis, the best articles from last month, and a list of…
 -
Latest Update (3/14/25) from the Free Bullion Investment Guide
Mar 14, 25 11:23 PM
Free Bullion Investment Guide's Latest Updates: Mexican Gold and Silver Libertad - 2024 Mintage Figures & more... -
Newsletter of the Free Bullion Investment Guide - February 2025
Feb 12, 25 03:58 PM
 The February 2025 newsletter of the Free Bullion Investment Guide provides the latest updates, fundamental and technical gold and silver market analysis, the best articles from last month, and a list…
 -
Newsletter of the Free Bullion Investment Guide - January 2025
Jan 13, 25 11:28 AM
 The January 2025 newsletter of the Free Bullion Investment Guide provides the latest updates, fundamental and technical gold and silver market analysis, the best articles from last month, and a list o…
 -
Newsletter of the Free Bullion Investment Guide - December 2024
Dec 12, 24 08:43 PM
 The December 2024 newsletter of the Free Bullion Investment Guide provides the latest updates, fundamental and technical gold and silver market analysis, the best articles from last month, and a list…

18W LED Security Light (Dusk to Dawn & Motion Sensor) - $32.99
from:
 LED Lighting


Keep this Guide Online
& Paypal
Thank You for
Your Support
Search the Guide
| search engine by freefind | advanced |

Daily
Newsletter
Mintages
for
2024
Gold & Silver Mexican Libertad
|
Gold Libertads |


Chinese Gold Coin Group Co.
& Chinese Bullion


2025
Gold & Silver Chinese Panda

|
Silver Panda |


Help Us Expand our Audience by forwarding our link
www.free-bullion-investment-guide.com.
Thank You!
March's

All Articles were Originally Posted on the Homepage