ExpressGoldCash - 4.9 star - Customer Reviews
December Dips
Gold & Silver Market Analysis
An in-depth look at How and Why Gold (and Silver) have Moved Every December in the Precious Metals Bear Market
Originally Posted on 11/20/2016 @10:58pm
by Steven Warrenfeltz
December Dips - it’s better to know in advance why a market dips.
In quick review, in Last Week’s Analysis of gold and silver (seen here), I questioned gold and silver's drop in price and thought it could have been an "anomaly."
It wasn't, and things aren't looking better for the precious metals until after the New Year. So, after seeing the new reality in Gold and Silver, I started to think ahead.
One of the best pieces of advice that my uncle, who served in World War II as a Navigator and Pilot of the B-24 Liberator Bomber, gave to his children about investing and life was “To Always Keep Your Eye on the Horizon.”
Ironically, the only way to see what’s on the horizon for the Precious Metals is to look into their past.
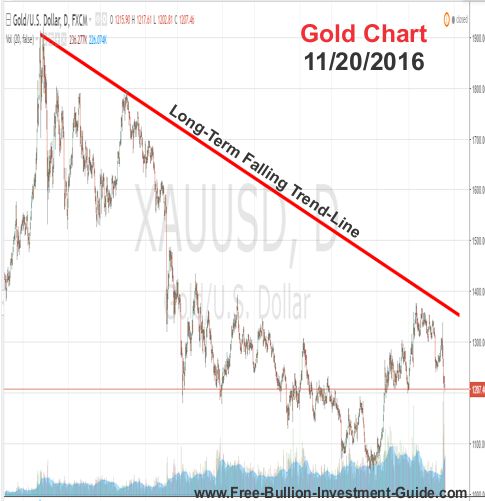
Gold and Silver have been in Bear markets since 2011, and although gold and silver’s movement for the rest of 2016 is technically still up in the air, gold has failed to break its long-term falling trend-line, repeatedly.
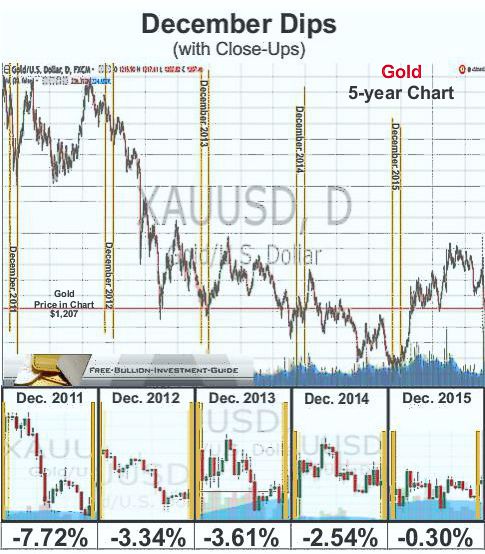
This week, I took a look back at gold’s 5-year Bear Market chart to see what could be on the “horizon” this coming December of 2016.
In the chart below, you can see that gold has dipped each December for the last five years.
Note: See close-ups under the 5-year chart with percentage changes for each year's December dip.
Chart provided courtesy of TradingView.com
The chart above clearly shows that December has not been kind to Gold (or Silver) in their bear markets. (Silver leads gold in their trading movements)
After studying the chart above, I realized that I was only getting half of the results into why Gold has dipped every December for the last 5-years, and to get the other half of the story; I had to look at this Guide's Quarterly Reports.
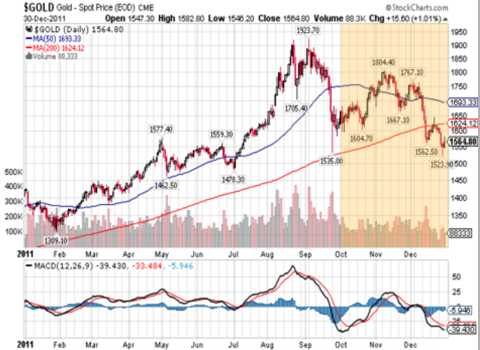
2011's December Dip
In the 2011 - 4th quarter page, I didn’t give any reason for the drop, mostly because this was my first quarterly report page and I wasn’t quite sure how I wanted to set up the page, yet.
But, the articles that are posted under the charts reminded me of some of the reason why the price dropped so dramatically in 2011 for gold, which include:
- investors moved back into U.S. Treasuries
- the U.S. Dollar’s rise
- the price of gold falling below its 200-day moving average
- inflation concerns decreased
- and signs of a gold bubble increased
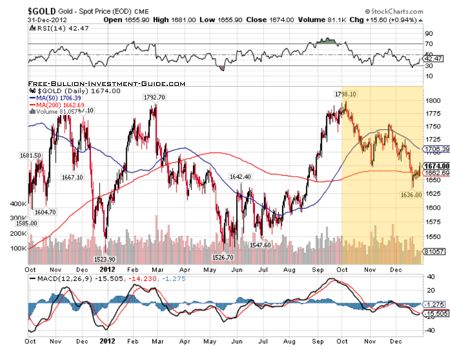
2012's December Dip
In 2012, I gave greater reasons for the movement in the prior quarter, however, in my explanation I did give a hint for December 2012's Dip.
Below the chart is what I wrote for Gold on the 4th quarter page:
During the previous quarter Gold's price had risen from the $1500's to above $1700.00, a troy ounce.
The Golden Cross late in the last quarter was a bullish signal. However, there were other things going on in the world that was having an effect on Gold's price.
Two of those events were the U.S. Presidential Elections, and in
the mainstream media, there was the constant talk about the dreaded "Fiscal Cliff."
These two current events at the time, left gold, silver, and platinum searching
for a positive or negative direction, ultimately all three precious metals
ended the year negatively. Palladium, on the other hand, ended 2012 on a
positive uptrend.
The hint in the description above for what was behind gold's fall was the "Fiscal Cliff."
I remember thinking at the time that the budget issues in Washington should give strength to Precious Metals, but it didn't this time.
The Bush Tax-Cuts were set to sunset at the end of the year which caused a great debate among the political parties, but the Obama Administration dug in his heels to let the tax cuts expire, so taxes were expected to rise.
The result of this was the market sold gold and bought the U.S. Dollar because when taxes increase it gives strength to the U.S. Dollar.
2013's December Dip
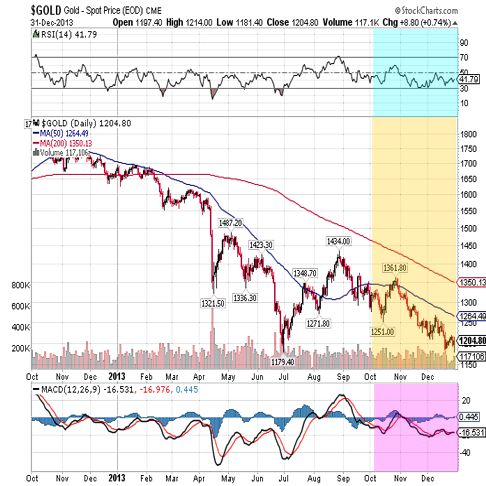
For 2013, I didn’t comment at all on the fundamental reasons why gold fell in the quarter; I only gave technical reasons why gold fell in the 4th quarter.
However, in the articles below the charts (on the quarterly page), I found this video from Bloomberg that breaks down how and why gold moved the way it did for the full year of 2013.
VIDEO : Bloomberg - Too Many Bears in the Woods for Gold
2014's December Dip
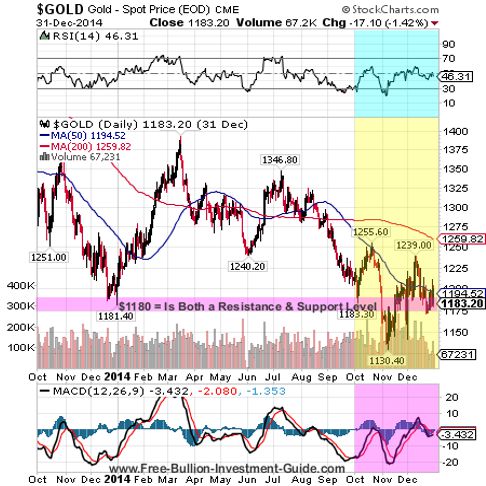
To understand why gold fell in the 4th quarter of 2014, I found my answers from the quarter's U.S. Dollar analysis:
During the 4th Quarter of
2014, the US Dollar Index has moved in the same direction as it did during the 3rd quarter of 2014; up.
There are several reasons why the US dollar has
moved up since
late June and early July.
- The decision by the Fed to end its QE (quantitative easing)program late last year has resulted in the US dollar gaining strength, as the markets look's forward to a change in the Fed's monetary policies.
- Positive U.S. GDP - 2nd Quarter GDP was 4.6% and 3rd Quarter GDP was 3.5%. In addition, consumer sentiment was recorded at its highest levels since the financial crisis.
- The massive monetary expansion by the Bank of Japan has resulted in a stronger dollar, against the yen.
- Fear of a recession in the Europe and Mario Draghi (President of the European Central Bank) is expected by the markets to implement his own form of QE, which has weakened the Euro against the US Dollar.
- The markets expect Janet Yellen, the Federal Reserve Chairman, to raise short-term interest rates.
Quarterly Charts provided courtesy of StockCharts.com
2015's December Dip
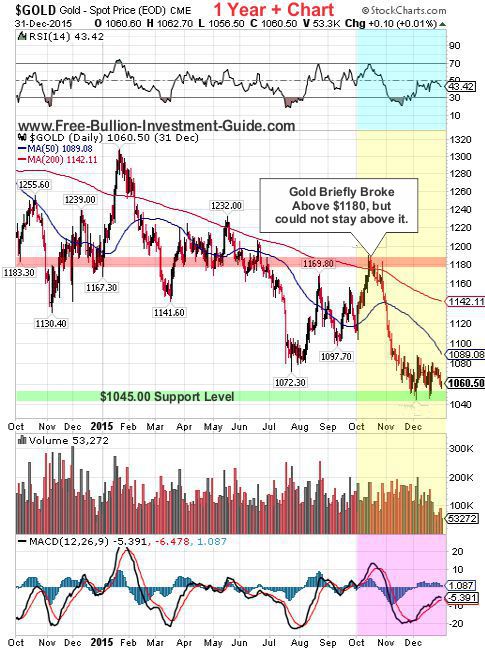
In 2015, this is the explanation I gave for gold’s price move in the 4th quarter report:
For the last two years, gold's price has been dictated by the Fed's
decision or lack thereof, to raise interest rates.
Since the Federal Reserve ended QE in October of 2014, Wall Street
has been expecting an Interest rate hike, but the Fed has failed to act.
The dovish talk from the Federal Reserve caused gold to rise in the
first few weeks of the quarter.
The price of gold rose so much that it briefly broke above the $1180 price resistance level.
But, shortly after the Fed failed to raise rates in October, the Fed
changed its tune and started to speak hawkishly for a rate hike in December.
In addition, the markets expected the ECB to increase its own form of QE at its December 3rd meeting.
Conclusions
In conclusion, there are two other big factors that you need to know as to why gold’s bear market has seen its December dips.
1st: At the end of every year the market is thinly traded. Most market traders are done with their work for the year, so they take off for Christmas and New Years and don't come back until after the first of the new year.
2nd: Gold Started each year from 2011-2015 at a higher price than it ended. To reduce Capital Gain Tax burdens, Investor’s sell off losing assets at the end of the year (December).
As for the rest of 2016, gold started Jan. 2016 at a 7year low, but not many investors got into the gold market until after it rose above $1250.
So because of this, if gold is below $1250 in the latter half of December it may test its Jan. 2016 low of $1060.50.
One Last Thing...
As for the week ahead, I’ve decided not to post any charts this week for Gold, Silver and the U.S. Dollar; Before I offer more analysis on their movements, I'm going to let the dust settle after the strong moves.
Overall, I’m looking for moderate reversals in the price of Gold, Silver and the U.S. Dollar.
So until next week, I hope you have a Happy & Safe Thanksgiving!
Thank You for Your Time!
To view prior Blog posts - Go to the Bullion Guide's Blog.
For our 2016 Blog posts see our Tumblr Archive page.
|
Support this Guide & Paypal Thank You for Your Support |
|
|
 | |||||

Ad Gloriam Dei
This website is best viewed on a desktop computer.
Keep this Guide Online
& Paypal
Thank You for
Your Support
with Feedly
Search the Guide
| search engine by freefind | advanced |
Premium Canadian Bullion
Give a lasting gift of the iconic Silver Maple Leaf bullion coin [More]
Free Shipping on Orders over $100 (CDN/USA)
or
From the U.K. Royal Mint


Daily
Newsletter
Updated Mintages for
American Gold Buffalo
American Gold Eagle
American Silver Eagle
2024 & 2025
Jerusalem of Gold Bullion
Coin photos
(bottom of page)
Mintages
for
2024
Gold & Silver Mexican Libertad
|
Gold Libertads |
Chinese Gold Coin Group Co.
& Chinese Bullion
Help Us Expand our Audience by forwarding our link
www.free-bullion-investment-guide.com.
Thank You!
Last Month's

In No Particular Order
November 2025
All Articles were Originally Posted on the Homepage

