A Large Bull Flag is
in Gold's Chart -
Update
Review and Outlook for the U.S. Dollar, Silver, and Gold
Originally Posted on 4/15/2018 @ 4:18 pm EDT
Last Edited on 4/16/2018 @ 10:54 am EDT
by Steven Warrenfeltz
Subscribe to this Blog
Hello,
Thank you for visiting the Free-Bullion-Investment-Guide, every visit you make is greatly appreciated.
Before we get to this Review & Outlook, below are some of the Best Bullion Market-Related News articles that were taken from this guide's home page, over the last week.
My apologies; I missed posting the news a few days last week, so the list of news links below is a little less than on previous blog posts.

STOCK BUYBACKS: Corporate America Will Bring Next Wave of Pain, Money Managers Warn - Bloomberg
CBO Report: Spending Blasts Off - CATO Institute
SILVER INDUSTRIAL DEMAND REBOUNDED IN 2017; MINE SUPPLY RECORDED SECOND CONSECUTIVE LOSS - The Silver Institute
Americans Used To Be Savers - Real Investment Advice
Best of the Week for
Gold NanoParticle Cancer Research
Simple Breath Test Can Detect Cancer and 16 Other Diseases - CORE SPIRIT
Review & Outlook
|
All the charts on this blog are Daily Charts unless noted otherwise.
US DOLLAR
In Review
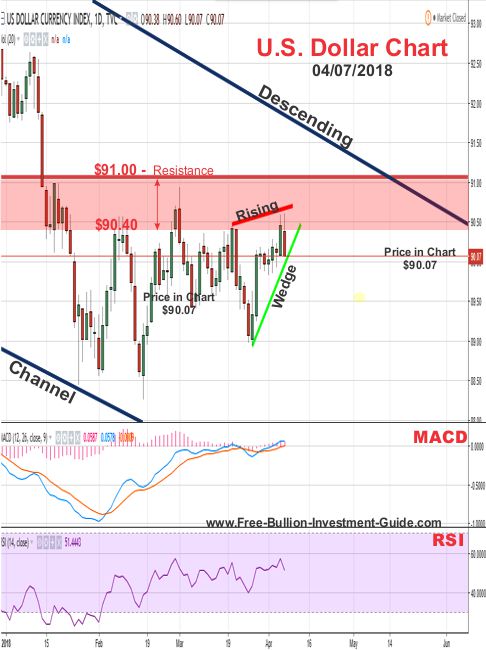
In last week's blog post, I wrote the following outlook for the U.S. Dollar and posted the chart below.
In the U.S. Dollar's outlook chart below, it has formed a negative 'Rising Wedge' pattern.
The pattern isn't expected to hold up for too long for two reasons.
First, the dollar is trading near the end of the 'Rising Wedge' pattern, and two, as we've seen for the last several weeks, the dollar can't seem to trade above the $90.40 price level for more than one day.
So, in the near future, we should have seen the dollar confirm the negative pattern below and move lower in price.
U.S. Dollar - In Review - continued
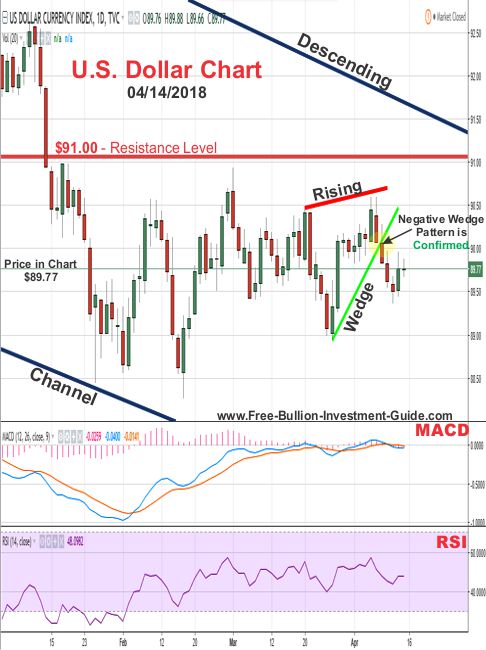
In the review chart below, you can see that the outlook commentary above was correct, the dollar fell through the wedge shortly after the outlook chart above was posted.
U.S. Dollar - Outlook
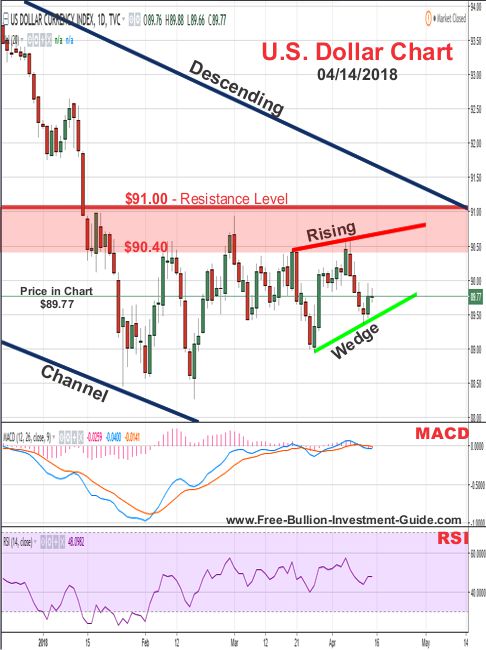
For the U.S. Dollar's Outlook, nothing has really changed from last week.
Even though the U.S. dollar confirmed the 'Rising Wedge' in last week's chart above, the same 'Rising Wedge' pattern is still in its chart, it's only a little broader this week.
Since this 'Rising Wedge' is a little broader, the dollar could trade inside it for a little longer before it confirms the negative pattern by falling below the lower trend-line of the wedge.
However, as I am writing this section (Saturday, 4/14) it's in the news that the United States, Britain, and France have launched airstrikes on Syria for their use of chemical weapons, so the dollar may fall sooner than I've stated.
Time will tell what happens.
Charts provided courtesy of TradingView.com
U.S. Dollar's Price Resistance and Support Levels
U.S. Dollar's Resistance Levels
$91.00
$90.40
U.S. Dollar's Support Levels
$88.00
$87.00
SILVER
In Review
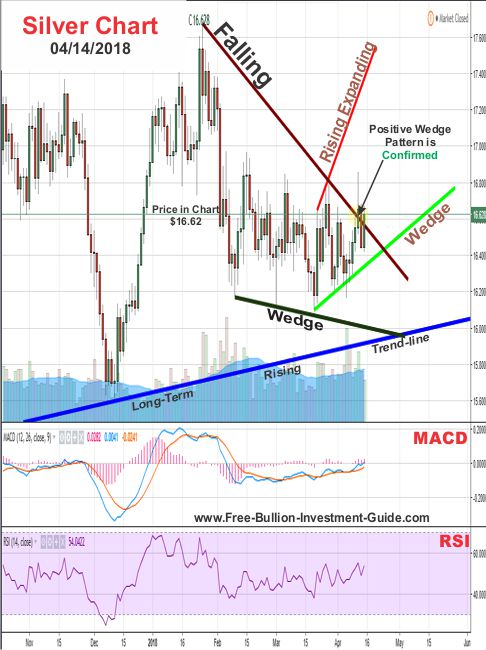
Last week, the chart and commentary below was posted for silver's outlook.
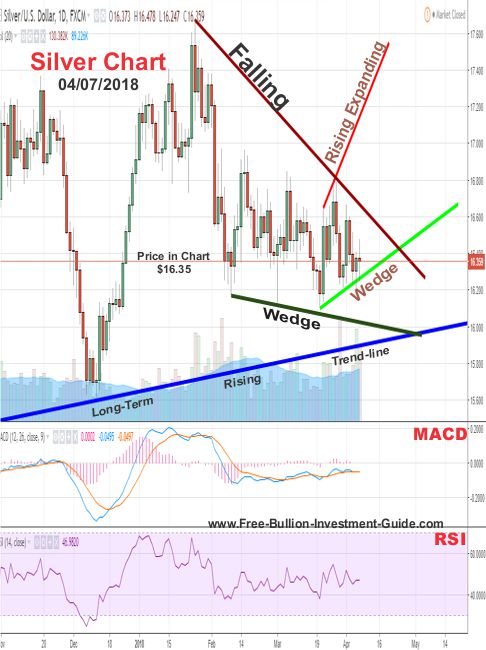
In the chart below, you can see silver now has two patterns that have been identified in its chart.
The larger of the two patterns is a positive 'Falling Wedge' pattern and the other is the same negative 'Rising Expanding Wedge' pattern in the chart above.
Both patterns are expected to be confirmed sometime in the near future, the question is; which one will be first?
If you don't already do this, I would encourage you to start following my chart set-ups on TradingView.com, their charts are free to use.
By doing this you too can see which pattern will be confirmed first; furthermore, if you are looking to buy silver, it will help you better judge when to make your investment.
For instance; if the Rising Expanding Wedge is confirmed first, then the time to buy the dip is very soon.
But, on the other hand, if silver confirms the 'Falling Wedge' first, then you know to hold off your purchase because a dip in the price of silver is most likely going to happen shortly thereafter.
Note: Tradingview.com is an affiliate of this guide, but I use the free charts to construct each blog post, you only pay when you wish to receive more of their services.
Silver - In Review - continued
In the chart below, you can see that the 'Falling Wedge' pattern was confirmed, last week.
However, as you will see in the outlook below, not much has changed for silver, from last week, the lines have just been re-drawn.
Silver - Outlook
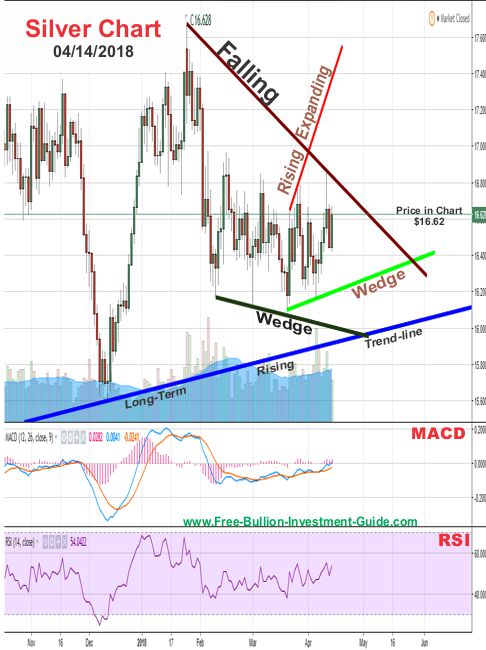
In the outlook chart below, you can see that nothing much has changed from last week.
Even though the 'Falling Wedge' was confirmed in silver's chart, it could still be drawn, so it was kept in the chart below.
Furthermore, the 'Rising Expanding Wedge' has also been redrawn.
Two weeks ago, silver made a new low under the bottom of the wedge, but it did not close the day below the wedge, which is why the pattern was not confirmed or denied.
I explained as to why I didn't call ' confirmed in the 'Silver Review - Chart' section of last week's blog.
Just so you know, I don't confirm patterns on 'highs and lows' only on when the price has closed above or below an identified pattern's trend-lines is the pattern confirmed or denied on the charts found in this blog.
As for the week ahead, there are too many fundamental variables to consider when trying to determine silver's future.
From the Syrian airstrikes to the continued issues of trade between the United States and China, anything could literally rattle the markets and silver for that matter.
Because silver is an industrial metal, as well as a safe haven asset, it is prone to drop when the stock market drops, much more-so than gold, so I'll be keeping a close watch on the news to see how silver moves this week.
Charts provided courtesy of TradingView.com
Silver's Price Resistance &
Support Levels
Silver's Resistance Levels
$17.50
$17.00
Silver's Support Levels
$16.10
$16.00
GOLD
In Review
Last week two charts were created for Gold's outlook, below you'll find both of the charts and commentary that was written in last week's gold outlook.
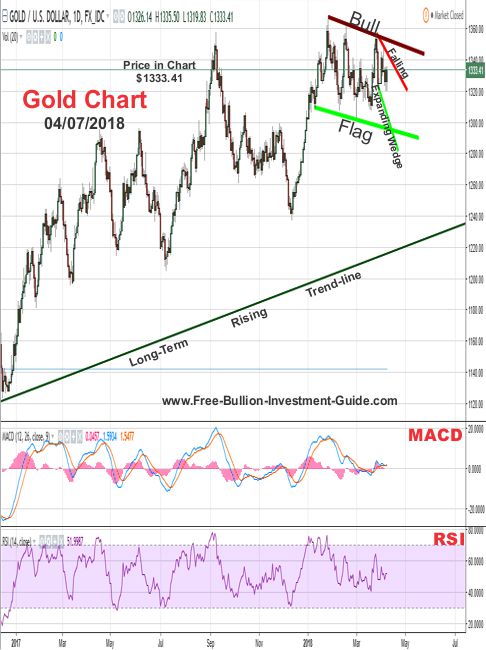
In the outlook chart below, gold has formed a positive 'Falling Expanding Wedge' pattern.
But, this week, I've added another 'Outlook Chart,' below this one, to show you a large positive pattern that has been identified in gold's chart.
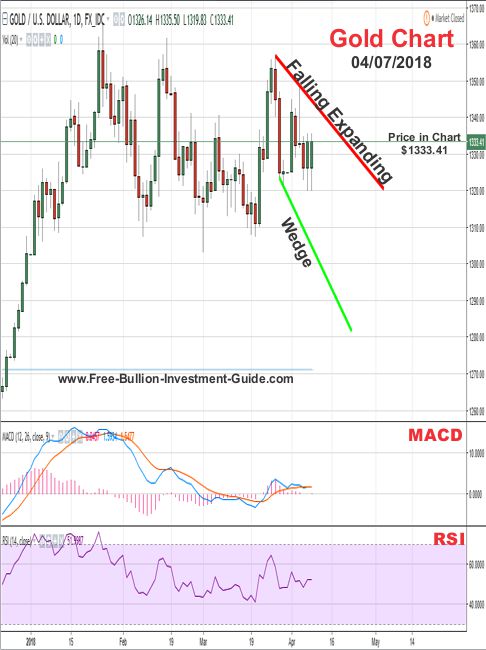
Since the beginning of the year gold's been moving sideways, consolidating its price and in doing so it has created a large 'Bull Flag.'
As to when this very positive pattern will be confirmed is anyone's guess, but it may happen sometime shortly after the 'Falling Expanding Wedge' is confirmed.
However, as you can see in the chart above, the 'Falling Expanding Wedge is broad, so gold could easily trade inside it for a while before it confirms it by breaking to the upside.
In addition, the fact that the 'Bull Flag' has been identified, is a very good sign for gold.
And although it doesn't give us any idea as to how soon it will be confirmed, it does give us a very good idea as to where it is going.
Time will tell how and when these patterns are confirmed in the future.
In Review - continued
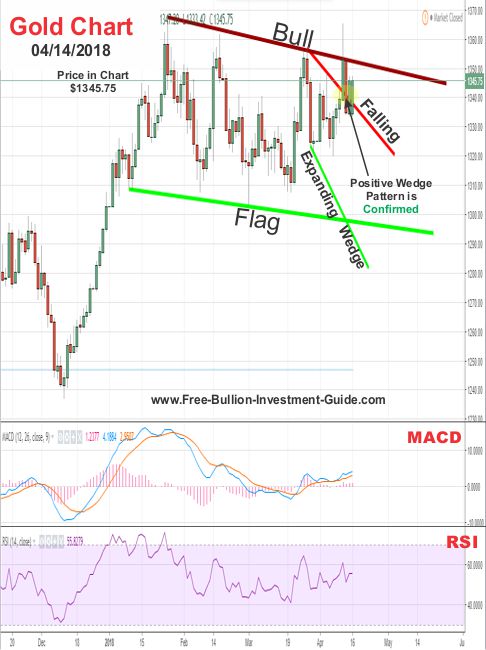
In gold's review chart below, you can see that gold confirmed the positive 'Falling Expanding Wedge' pattern.
In addition, it also confirmed the upper trend-line of the 'Bull Flag' by closing and opening trading on the pattern's upper trend-line, last week.
On Wednesday - 4/11, gold reached up above the 'Bull Flag' last week in a panic trade 'high', but it did not close above it, the panic trade is addressed below, in gold's outlook.
Gold - Outlook

In some of the technical analysis that I see, if a 'high or low' trade is made above or below a trend-line of an analyst's identified pattern, that pattern is considered to be 'confirmed or denied,' whatever the case maybe.
I don't agree with this way of analyzing charts.
If a pattern is broken, then the price should break the pattern convincingly by breaking one of the pattern's trend-lines and closing the trading day above or below it.
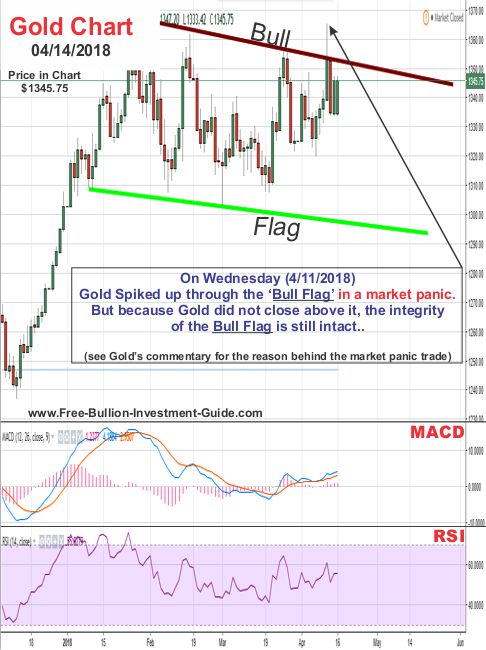
But calling a pattern confirmed on the 'flawed' panic trade last Wednesday (4/11) is a bad call, which is why I'm not calling the 'Bull Flag' confirmed or denied, yet.
In the outlook chart below, you can see that Gold moved above the 'Bull Flag' but it could not close the day above it.
President Trump's tweet about bombing Syria helped to create gold's panic trade 'high' by telling the market that missiles 'will be coming' to Syria.
The President's tweet was made in the morning of Wednesday - 4/11, but the 'flawed' panic trade came later in the day when night started to fall on Syria, when traders thought the missiles were going to start hitting Syria.
I too, thought that bombs were going to start falling when night fell in Syria, as I stated in this tweet: here.
But they didn't fall until this weekend, so perhaps the panic trade was a precursor of what the market will do Monday morning - (4/16).
Ultimately, time will tell how gold moves, but there are a lot of fundamental factor's that are working in gold's favor and because of this the 'Bull Flag' is expected to be confirmed sometime in the near future.
Charts provided courtesy of TradingView.com
Gold's Price Resistance and
Support Levels
Gold's Resistance Levels
$1380.00
$1350.00
Gold's Support Levels
$1300.00
$1280.00
Thank You for Your Time.
Have a Great Week and God Bless,
Steve
'Click Here' see all of the prior Blog posts,
Thank You for Your Time!
|
Investment/Information Disclaimer: All content provided by the Free-Bullion-Investment-Guide.com is for informational purposes only. The comments on this blog should not be construed in any manner whatsoever as recommendations to buy or sell any asset(s) or any other financial instrument at any time. The Free-Bullion-Investment-Guide.com is not liable for any losses, injuries, or damages from the display or use of this information. These terms and conditions of use are subject to change at anytime and without notice. |
Return from this Guide's Latest Blog Post
|
Support this Guide & Paypal Thank You for Your Support |
|
|
 | |||||
Free Bullion Investment Guide
Keep this Guide Online
& Paypal
Thank You for
Your Support
Search the Guide
| search engine by freefind | advanced |

Daily
Newsletter
Mintages
for
2024
Gold & Silver Mexican Libertad
|
Gold Libertads |
Chinese Gold Coin Group Co.
& Chinese Bullion
2025
Gold & Silver Chinese Panda
|
Silver Panda |
Help Us Expand our Audience by forwarding our link
www.free-bullion-investment-guide.com.
Thank You!
March's

All Articles were Originally Posted on the Homepage
