Homepage / Archived News or Quarterly News / 2nd Quarter 2015

Free Shipping on Orders $199+
2nd Quarter - 2015
Charts, Bullion News & Commentary
Date Posted: 8/06/2015 @1:27am
When investing in any market, a good way to judge price movement in the future is to learn from the past.
The charts and bullion news links on this page are largely devoted to the precious metals market during the 2nd quarter of 2015. All of the news links posted below were originally posted on the homepage.
The charts below are provided courtesy of StockCharts.com.
US Dollar Charts
2nd qtr. of 2015
US Dollar Quarterly - Price Chart (April 1st, 2015 - June 30th, 2015)

The US Dollar Summary
Early in the 2nd Quarter of 2015, the US Dollar moved down from its peak of 100.71.
Wall Street anticipated an interest rate hike by the Federal Reserve, but when that rate hike didn't happen, the U.S. dollar fell because the possibility of a future rate hike was the only reason the U.S. Dollar was rising.
Bullion News
US Dollar 1 year - Price Chart (April 1st, 2014 - June 30th, 2015)

Bullion News
The one-year US Dollar chart (above) displays the dollar's closest price resistance and support levels.
US Dollar 3 year - Price Chart (April 1st, 2012 - June 30th, 2015)

Bullion News
In the future, the dollar will have to break two resistance levels to continue its bull market.
In addition, if the Federal Reserve continues to balk at raising rates and if the U.S. Dollar falls below the $93.00 support level, it will be the first sign of a possible new bear market for the U.S. Dollar.
The 10-year chart below indicates the $93.00 support level, which was a resistance level for the US Dollar in 2005.
US Dollar 10 year - Price Chart (Jan 1st, 2005 - June 30th, 2015)

Bullion News

4.7 star - Customer Reviews
Gold Price Charts
2nd qtr. of 2015
Gold Prices
Gold Quarterly - Price Chart (April 1st, 2015 - June 30th, 2015)

Bullion News

The price of Gold during the 2nd Quarter of 2015 was very choppy. However, what's happening in the chart is a battle, a battle between Gold's Bulls and Bears.
The bears repeatedly battled the bulls during the quarter, testing their ability to keep the price of gold above $1180.
continued...
Gold Quarterly - Price Chart (April 1st, 2015 - June 30th, 2015)

Bullion News
Since the summer of 2013, the bears have been continuously testing the bulls at the $1180 level, but they have lost every battle.
However, in November of 2014, during the 4th quarter of 2014, Gold's Bears were able to break through the bull's price support level of $1180, briefly touching $1130. (see below)
Gold 1year - Price Chart (April 1st, 2014 - June 30th, 2015)

Late in this quarter, the price of gold broke below the $1180 support level, turning it into a powerful new resistance level.
The $1180 price level was an important support level for the price of gold, and now that this two-year level has broken, expect to see gold continue to fall in price. This is the same thing that happened to gold's price when it broke the long-standing $1550 support level in early 2013.
continued....
Gold 5year - Price Chart (April 1st, 2010 - June 30th, 2015)

Bullion News
The new support level for gold is $1130; support below $1130 is at $1000 per troy ounce of gold.
Gold 15year - Price Chart (January 1st, 2000 - June 30th, 2015)

Silver Price Charts
2nd qtr. of 2015
Silver Price Summary
Silver's price during the 2nd quarter of 2015 was choppy; it fell for most of the first month of the quarter, then popped up in price, but ultimately, silver gave up all its gains and ended the quarter at a lower price than it started the quarter.
Silver Quarterly - Price Chart (April 1st, 2015 - June 30th, 2015)

Bullion News
Silver 1 year - Price Chart (April 1st, 2014 - June 30th, 2015)

Silver 3year - Price Chart (April 1st, 2012 - June 30th, 2015)

Platinum Price Charts
2nd qtr. of 2015
Platinum Price Summary
Platinum's price chart for the 2nd quarter of 2015 had one general direction: down.
continued...
Platinum Quarterly - Price Chart (April 1st, 2015 - June 30th, 2015)

Bullion News
Platinum broke below its support level of $1085 in mid-June. The price of platinum attempted to break back above the level two more times but was unable to hold the level for more than one trading session.
continued...
Platinum 1 year - Price Chart (April 1st, 2014 - March 31st, 2015)

Now that the $1085 price level for Platinum has been broken, it is a Resistance Level that the price will likely overcome sometime in the future.
Platinum's New Support Level
To find Platinum's new support level, we have to go back to 2008, during the height of the financial crisis, when platinum sat at $800.00 per troy ounce.
Platinum 13 year - Price Chart (January 1st, 2002 - June 30th, 2015)

Palladium Price Charts
2nd qtr. of 2015
Palladium Price Summary
For the quarter, Palladium looked pretty good, until late May.
continued...
Palladium Quarterly - Price Chart (April 1st, 2015 - June 30th, 2015)

Bullion News
As mentioned in last quarter's - Palladium portion of the page, the RSI was signalling that early this quarter, higher prices should be showing up.But in late May and early June, the momentum changed for Palladium, breaking its support level of $720 a troy ounce. Once a Support Level is broken, that level becomes a Resistance Level.
continued...
Palladium 1 year - Price Chart (April 1st, 2014 - June 30th, 2015)

Bullion News
We find the next support level for Palladium, by looking at its 5-year chart. Support for Palladium now sits at the $535.00 price level (below); we will see in the next quarter if the price can stay above this level.
Palladium 5year - Price Chart (April 1st, 2010 - June 30th, 2015)

The charts above are provided courtesy of StockCharts.com.
2nd Quarter - 2015
Bullion News & Commentary
The Quarterly News starts with the end of the quarter articles, first.
Please note that not all of the links below work; the links are kept because the headlines still provide insight into how the markets were moving at the time.
06/30/2015 - Bullion News
CHARTS : dshort - NYSE Margin Debt: A 1.6% Decline from Last Month's Record High
RT - Jim Rogers ‘Greece should go bankrupt, get it over & start it over’
Economic Policy Journal - How Greece’s Debt Has Shifted Since the Last Bailout
CHARTS : Trading Floor - What's Wrong with Gold?
TECHNICAL ANALYSIS : Kimble Charting - Junk bonds diverging, could send bearish message to stocks!
Business Insider - One of Puerto Rico's biggest creditors just warned the island that it's not about to negotiate
TECHNICAL ANALYSIS : CEO.CA - Gold Set to Make Major Seasonal Low This Week
Reuters - China targets counterweight in gold trade with yuan fix
Bloomberg - Europeans Rush to Gold Coins as Bank of Greece Stops Sales
The Deviant Investor - Silver About to Turn More Volatile
Perth Mint Research - Precious metal derivatives decline 29%
MineWeb - Palladium heading for worst first half since ‘03
WASTE : Daily Mail - U.S. Air Force's Most Sophisticated Stealth Jet is Beaten in Dogfight by Plane from 1970s... Despite Being the Most Expensive Weapon in History
06/29/2015 - Bullion News
TECHNICAL ANALYSIS : Kimble Charting - King Dollar Could Be Creating Unhealthy Bearish Pattern!
CoinNews - Gold Rises on Greek Worries; US Mint Bullion Coin Sales Soar
LIVE UPDATES : The Guardian - Greek crisis: Banks Shut for a Week as Capital Controls Imposed - As It Happened
Reuters - Gold firms as Greece fears pressure global stock markets
VIDEO : CNBC - Santelli Exchange: The Greek tragedy
GoldSeek - SWOT Analysis: Upside Momentum for Gold Looks Strong in Second Half of the Year
AUDIO : SRSrocco Report - India Hoards Silver; Massive Disconnect In Stocks & Bonds
INFO~GRAPHIC : Visual Capitalist - Puerto Rico’s Debts Are “Not Payable” According to Governor
Business Insider - Puerto Rico now belongs to Wall Street
VIDEO : Kitco - Why Is Gold Not Reacting To Greece? - RBC's George Gero
Investment U - Deep in the Dragon’s Belly: A Visit Inside a Silver Refinery
VIDEO : Economic Policy Journal - New F. A. Hayek Interview Emerges on Monetary Policy, the Gold Standard, Deficits, Inflation, and John Maynard Keynes
The Speculative Investor - Large investors can’t buy US dollars
The Gold Report - Jeb Handwerger: Fed Interest Rate Increase Could Be Best Thing to Happen to Gold
06/28/2015 - Bullion News
U.S. Global Investors - There’s a Huge Disparity Between How Regulators Deal with Gold and Stock Market Manipulation by Frank Holmes
LIVE UPDATES : The Guardian - Greek crisis: Banks Shut for a Week as Capital Controls Imposed - As It Happened - New Link (6/29)
Economic Policy Journal - "Nothing is Confirmed Until Officially Denied"- Bismark
GoldReporter.de - "Commercials" increase gold sales by 32 percent
Peak Prosperity - The Global Credit Market Is Now A Lit Powderkeg
NewsMax Finance - The Banking Industry Needs to Change
Daily Sabah - 83 Countries Went Bankrupt in 200 Years - the U.S. has declared bankruptcy five times, since its foundation
CHARTS : SRSrocco Report - TOP 5 GOLD PRODUCERS: Stunning Decline In Gold Productivity
Bloomberg - BlackRock Seeks SEC Clearance for Internal Fund Lending
Cobden Centre - Mainstream view of what velocity is
Reuters - China plans to launch yuan gold fix by end of 2015
The BRICS POST - 57 countries to sign China-led Bank charter on Monday
CHARTS : dshort - World Markets Weekend Update: The Shanghai Selloff Continues
Reuters - Tsipras tells Hollande, Merkel that Greece will survive
Daily Mail - SIMON LAMBERT: How to spot a Greek euro note (again) - and why this old chestnut is a damning indictment of the eurozone crisis
06/26/2015 - Bullion News
Economic Policy Journal - Social Security is the Titanic Headed for the Iceberg
Business Insider - The Greek prime minister is planning for a referendum
TECHNICAL ANALYSIS : SOLARCYCLES - The Bubble Within The Bubble
Zero Hedge - Consumer Confidence Surges To January Cycle Highs (Near 11 Year Highs)
VIDEO : CNBC - Santelli Exchange: Markets Waving Goodbye to Lower Rates
Paul Nathan - Inflation, The Money Supply, And Gold
FAKE BULLION ALERT : CoinWeek - Counterfeit Detection: 2012 $50 American Gold Eagle
TECHNICAL ANALYSIS : Trading View - A Possible future for Silver...???
Kitco - Falling Chinese Equities Should Help Support Gold Prices – Analysts
MINING - China readies to launch yuan gold fix before year-end
Market Watch - Why Jim Rogers is buying what everyone else is selling
The Bullion Desk - TOCOM granted licence to use LBMA Good Delivery list
Live Science - Athenian Wealth: Millions of Silver Coins Stored in Parthenon Attic
THV11 - Colorado woman finds 8.52 carat diamond at Arkansas park
06/25/2015 - Bullion News
PDF : Incrementum - In Gold we Trust 2015 – Extended Version
CoinNews - Gold Falls for Fifth Session; US Mint Gold Sales Gain
TECHNICAL ANALSYSIS : Kimble Charting - Stock market bulls…Risk are high if the Dow turns weak here!
VIDEO : The Street - Chinese Gold Standard Could Create 'Fireworks' - Bloomberg Intelligence
Reuters - China plans to launch yuan gold fix by end of 2015
The Dollar Collapse - Another Week, Another Chinese Gold Mine
AUDIO : The Goddard Report - John Rubino - Will Greek Economic Crisis Ever End?
Reuters - No deal for Greece, creditors; top-level talks resume Saturday
The Deviant Investor - When Will US Debt Hit the Wall?
TheGoldandOilGuy - Americans have no idea that the United States is on the brink
CHARTS : dshort - Kansas City Fed Survey: Manufacturing at Levels Last Seen in Mid-2009
TECHNICAL ANALYSIS : Market Anthropology - 99' Barrels of Crude on the Wall...
VIDEO : CNBC - Gold's next move, with George Gero, RBC Capital Markets
Calgary Herald - 5 things to know about the new silver Calgary Stampede coin
06/24/2015 - Bullion News
Reuters - China likely to get central bank nod for yuan gold fix soon -sources
TECHNICAL ANALYSIS : Kimble Charting - Dangerous “kiss of resistance” for Transports! Spill over to S&P 500?
The Telegraph - Greek crisis: deal unravels as both sides reject proposals and Tsipras is summoned to late night talks
Free Market Cafe - Gold in the Age of Soaring Debt by Frank Holmes
Business Insider - The 'Love Trade' is Supporting Gold by Frank Holmes
MoneySmartGuides - Be A Steady Saver
CoinNews - Gold Drops for Fourth Session, Silver Rebounds
Sunshine Profits - Gold News Monitor: Global Bubbles Update
GoldReporter.de - Aktien-Crash: Chinesische Anleger flüchten ins Gold
CHARTS : StreetTalkLive - Predicting The Future Is Difficult
CHARTS : Zero Hedge - The Mystery Of The "Missing" Inflation Solved: Record Number Of US Renters Can't Afford Housing
AUDIO : McAlvany Weekly Commentary - George Gilder: Bitcoin, Gold & Freedom
SRSrocco Report - Gold & Silver Eagle Sales Spike In June As The Market Senses Financial Turmoil
The Speculative Investor - More confusion about gold demand
CoinWorld - U.S. coins capturing history: Battle of Saratoga turns Revolutionary War - America The Beautiful quarter dollar recalls surrender of Gen. Burgoyne
Free Shipping on Orders $199+ | 5.0 star Customer Reviews
06/23/2015 - Bullion News
CoinNews - Blue Ridge Parkway 5 Oz Bullion Coin Temporarily Sells Out
The Guardian - Creditors' Economic Plan for Greece is Illiterate and Doomed to Fail
CHARTS : Business Insider - There are 4 Kinds of Bubbles and Only One of Them is Truly Frightening
Rick Ackerman - Retired at 52, a Teacher Faults NJ’s Generosity
Business Insider - Big investors are dumping stocks like it's 2008
The Bullion Desk - Bullish Case for Palladium price Fading
INFO~GRAPHIC : Visual Capitalist - The Looming Copper Supply Crunch
The Deviant Investor - First Strike Capability: Gold or War
Market Watch - Here’s one bear market sign you’ve never seen before
International Man - Spendable Gold
Express - Treasure trove: Metal detector man finds hoard of gold and silver coins in farmer's field
Daily Mail - Is this ISIS’s currency? Terror group supporters reveal photographs of gold coins on social media
06/22/2015 - Bullion News
Bloomberg - Major Money Manager Braces for Bond-Market Collapse
Sputnik - China’s Stocks Retreat Most Since 2008 as Margin Trading Shrinks
CHARTS : GoldSeek - SWOT Analysis: Will Chinese Investors Rotate to Gold? by Frank Holmes
AUDIO : PhysicalGoldFund - The Gold Chronicles: June 17 , 2015 Interview with Jim Rickards
The Telegraph - Europeans raise hopes of Greek deal within 48 hours as Tsipras forced to swallow austerity
Market Watch - These are the 2 main points of contention in the Greek debt saga
TheTechnicalTraders - If You Have Money in a US Bank Account Be Aware!
BullionStar - Strong Withdrawals Mainland & Hong Kong Gold Vaults
VIDEO : CNBC - The state of US-China relations
CHARTS : StreetTalkLive - "Debt Gone Wild" - Debt Funded Stock Buybacks Soar
Business Insider - Think of it as housing bubble 2.0
CoinWeek - Perth Mint Announces New Chair and CEO
06/21/2015 - Bullion News
AUDIO : Peak Prosperity - Commodities Guru - Jim Rogers Gives Predictions on the Markets, Gold, Greece & More....
The Telegraph - 'It's time to hold physical cash,' says one of Britain's most senior fund managers
TECHNICAL ANALYSIS : biiwii - Gold’s Ratio Signals
GoldReporter.de - Gold market: "Commercials" build any new short positions on
BBC - Greece debt crisis: EU leaders step up efforts for deal
Forbes - Paul Krugman Is Right; Greece Should Leave The Euro
Twitter - James Rickards : Reminder for #Grexit crowd: IMF just loaned 222 million SDRs to Cyprus...
Business Insider - There's nothing stupider than the Fed's 'dot plot' Peter Lynch, famously said “If you spend more than 13 minutes analyzing economic and market forecasts, you’ve wasted 10 minutes.”
National Inflation Assoc. - Shanghai Stock Market Crash Has Begun!
Wealth Daily - Fed Parties Like it's 1929
Economic Times - World Gold Council welcomes government's draft policy on sovereign gold bonds
Secular Investor - A Significant Breakout In The Gold Price Soon?
CoinNews - Bill Calls for Breast Cancer Awareness Commemorative Coins
Boing Boing - Pirate treasure is real. Here's how we found it.
06/19/2015 - Bullion News
PLATA - The Coming Liquidation
TECHNICAL ANALYSIS : SOLARCYCLES - Today's Market Compared to 2000
TECHNICAL ANALYSIS : SafeHaven - Watch The VIX ...
Business Insider - It's a Bond Market Exodus
Project Syndicate - Taking the BRICS Seriously
CHARTS : dshort - ECRI: "Shifting Patterns in Recessions and Recoveries"
Notes from the Underground - Fed Up With the FED
Daily Reckoning - Deflation and Disruption
BBC - Greek debt: Merkel urges deal before Monday summit
Market Pulse - Why $1,200 Is Important for Gold
SRSrocco Report - FREEGOLD REBUTTAL: A Case For Much Higher Silver Prices
Reuters - Ex-MF Global trader settles CFTC manipulation claims for $500K
The Telegraph - How to invest in gold
The Hans India - Gold coins and a Selfish Man
06/18/2015 - Bullion News
U.S. Global Investors - Gold in the Age of Soaring Debt by Frank Holmes
CoinNews - Gold Surges Above $1,200 on Fed and Inflation News
TECHNICAL ANALYSIS : Kimble Charting - US Dollar forming a bubble?
TECHNICAL ANALYSIS : King One Eye - US Dollar Heads Lower To Test Support
CHARTS : Hambone's Stuff - The Fed's Gauges (and/or The Fed Itself) Are Entirely Full of Shit Regarding Employment...Here's Why
Market Watch - Why $1,200 is Important for Gold
GOLD NANO-PARTICLES : medGadget - On-Demand Delivery of Drugs from Nanoparticles Using Ultrasound
Bloomberg - Junkyard Palladium Strands Bulls Betting on Demand for Car Parts
Gold-Eagle - Russia Buy Gold Bullion For “Principles Of Diversification” – Central Bank Governor
Mish's Blog - Tax Revenue Collapses in Greece; Government Denies Capital Controls; Citizens Pull €2bn in Three Days
The Deviant Investor - 150,000 Cigarettes or 3,275 Ounces of Silver
GoldSeek - The Fed is Now Officially in VERY Serious Trouble
BullionStar - Bank Of England Custodian Gold Drops 351t
FAKE BULLION ALERT : Rockland County Times (NY) - Fake Coin Con Artist Sought by Clarkstown PD
06/17/2015 - Bullion News
SafeHaven - Axel Merk : Stop the Fed?!
VIDEO : CNBC - No meat on Fed bone: Santelli
VIDEO : Bloomberg - Yellen: We Haven't Decided When to Raise Rates
GoldCore - Bad Rumor : “People Can No Longer Buy Retail Gold Coins”
TECHNICAL ANALYSIS : Kimble Charting - Forget Greece & FED, better watch these European leading indicators!
CHARTS : dshort - WSJ Economists' June Forecasts for 10-Year Yields and the Fed Funds Rate
Daily Reckoning - The Market’s Euro Head Fake
The Independent - If Greece can wreck it, how strong was euro in the first place?
TECHNICAL ANALYSIS : SOLARCYCLES - Comparison to 1929
MineWeb - Smart investors buy gold when prices are low
AUDIO : McAlvany Weekly Commentary - Texas Governor to Fed: “Give Us Our Gold”
GoldSeek - For the moment, China wants gold held down as much as Western central banks do
National Inflation Assoc. - Mother of All US Bubbles
FallsNewsPress - Ohio House passes law providing sales tax break for precious metal purchases
06/16/2015 - Bullion News
The Washington Post - Why Nobody Believes the Federal Reserve’s Forecasts
TECHNICAL ANALYSIS : Trading Floor - There's a storm brewing for gold — look at the options skew
CHARTS : Hambone's Stuff - Economic Infanticide
TECHNICAL ANALYSIS : SOLARCYCLES - Is This ‘It’?
The Corner - Greece Rides the Ghost Train
CARTOON : Hedgeye - Sisyphus & Tsipras
MoneyBeat (WSJ) - Five Charts That Show How Investors Are Trading This Market
CoinNews - Gold, Silver Decline; US Mint Bullion Coins Extend Rally
VIDEO : Bloomberg - Platinum Market Latest Victim in Greek Debt Turmoil (Explained in first 40sec. of video)
The Deviant Investor - Gold Versus The Status Quo
VIDEO : Bloomberg - HSBC Securities Analyst James Steel discusses the gold demand in China
The Telegraph - Bank of China becomes first Asian firm to help set London's gold price
Market Watch - China, India are ‘changing the nature’ of gold bullion markets
CNBC - Why does a college degree cost so much?
Zero Hedge - What Happened The Last Time The Fed's Balance Sheet Hit 25% Of GDP
06/15/2015 - Bullion News
CoinNews - Gold Gains; US Mint Gold Coin Sales Surge
TECHNICAL ANALYSIS : Kimble Charting - Bond reversal pattern, suggest challenges for stocks ahead?
The BRICS Post - IMF team in China to assess reserve-currency status for yuan
TECHNICAL ANALYSIS : SOLARCYCLES - The Conundrum Of Our Times Part 2
TECHNICAL ANALYSIS : Clive Maund - BOND BOMBSHELL...
TECHNICAL ANALYSIS : The Bullion Desk - Palladium – Looking oversold – or is it?
BullionStar - Rectification Chinese Gold Trade Rules
The Independent - Greece crisis: Country could face 'state of emergency' if a deal is not reached
CDN - BitGold: Returning to the gold standard?
GoldSeek - Ronan Manly: As World Gold Council's membership falls, it hikes fees to GLD
Credit - Can You Pay Back a Debt in Pennies?
06/14/2015 - Bullion News
Market Watch - The Fed fears lifting interest rates, ex-insider says
TECHNICAL ANALYSIS : CEO.CA - The Next Big Trade in Gold
BBC - 'No deal' with Greece as talks in Brussels fail
Sputnik - Grexit to Cost the World One Trillion Euros in Losses
The Telegraph - Is Greece at risk of becoming the next Zimbabwe?
TECHNICAL ANALYSIS : Trading the Bias - $USD could go either way in the week ahead
TECHNICAL ANALYSIS : Street Talk Live - 5 Things To Ponder: The "Howard Mark's" Problem
CHART : The Speculative Investor - The Emotion Pendulum
MINING - Would Palladium Replace Gold as Engagement Rings Choice of Metal?
GoldSeiten - Thoughts on Gold - Google Translation Link
Mirror - Nazi gold: Violin maker claims to have found location of Hitler's £50m stash after cracking code
Bloomberg - The Three Books You Must Read if You Want to Argue About Gold
06/13/2015 - Bullion News
Investment Week - Bond bubble: One huge bang or a series of mini-pops?
Newsmax Finance - Christopher Whalen: Fed Has 'Deliberate Blind Spot' on Debt
The Guardian - Greece running out of time to avoid default, leaders concede
TECHNICAL ANALYSIS : SOLARCYCLES - The Conundrum Of Our Times :
Part 1
CHART : McClellan Financial - The Magic of 150 Months
CHART : Visual Capitalist - Black Swans on the Horizon
CHART : Investment U - This Debt Indicator Is Signaling a Market Sell-Off
FOFOA - Silver Dollar
BullionStar - Western Consultancy Firms Continue Making Up False Arguments In An Attempt To Debunk SGE Withdrawals
Texas.gov - Governor Abbott Signs Legislation To Establish State Bullion Depository
AUDIO : FSN - Interview with Chris Martension
Profit Confidential - Why I Remain Bullish on Gold When it’s Down and Out
COUNTERFEIT COINS : CoinWeek - Counterfeit Coin Detection – Australian 1917 P Gold Sovereign
IMAGES : MintNewsBlog - United States Mint Unused Coin Designs, Prt 1
IMAGES : MintNewsBlog - United States Mint Unused Coin Designs, Prt 2
06/12/2015 - Bullion News
InvestorPlace - What You Need to Know About the DOJ Probe of Gold Prices
Bullion Vault - $1180 Gold Price Stuck at 2013 Crash Low as US Rate Rise Negates Greek Crisis, Poll Shows German Stance Hardening
WallSt. Daily - Demand for Solar Is Shrinking Silver Supply
Sunshine Profits - The Future of Greece and Gold
Sputnik - Greece to Submit Counter-Proposals on Bailout Plan to Creditors
Bloomberg - Junk-Bond Defaults Growing as Pressure From Commodities Persists
TECHNICAL ANALYSIS : The Deviant Investor - Silver Lows and Bubble Bonds
U.S. Global Funds - Breaking from the Gold Standard Had Disastrous Consequences by Frank Holmes
Wealth Daily - Texas Gold Depository
Zero Hedge - Economist Cover: "Watch Out"
CNBC - Precious metals back in favor as volatility rises
CoinWeek - U.S. Mint to Launch Blue Ridge Parkway Quarter June 25
VIDEO : Bloomberg - 175 Quadrillion Zimbabwean Dollars Are Worth $5
Silver Coins Today - 2015 Bullion American Silver Eagles Surging
Zero Hedge - How Companies Mask Runaway Inflation
06/11/2015 - Bullion News
MineWeb - Gold: The US Sets the Price But Asia Does the Buying
VIDEO : CNBC - Charles Biderman, TrimTabs Investment Research, joins CNBC's Rick Santelli to discuss fund flows, corporate bond ETFs, and the economy
TECHNICAL ANALYSIS : Market Anthropology - Breaking Away
International Man - Beware the Money Illusion Coming to Destroy Your Wealth
The Telegraph - Bond crash across the world as deflation trade goes horribly wrong
CHARTS : dshort - The Fed Balance Sheet: What Is Uncle Sam's Largest Asset?
Finance and Economics - The fallacies of GDP by Alasdair Macleod
Market Watch - El-Erian sounds alarm over crisis in Greece
NewsMax - Gold Bulls Lose Key Ally as Diehard Coin Buyers Vanish in US
Market Watch - With gold, it’s time to play both sides against the middle
SRSrocco Report - INDIAN SILVER IMPORTS: On Track To Smash All Records
New China - Zimbabwe set to end use of defunct currency in Sept.
06/10/2015 - Bullion News
Keith Weiner Economics - How Could the Fed Protect Us from Economic Waves?
Secular Investor - GLD no longer is a market’s favorite and drops out of the top 10
Bullion Vault - I Agree with Hulbert
AUDIO : McAlvany Weekly Commentary - The Trap: Borrow Lots and Buy Stocks!
The Deviant Investor - Gold Bashers – Just For You!
GOLD NANO-PARTICLES : Cancer Therapy Advisor - Imaging Technique Identifies Early Metastasis in Lymph Nodes
The Speculative Investor - There’s no such thing as “money velocity”
TECHNICAL ANALYSIS : SOLARCYCLES - Update on the Global Economy
Daily Reckoning - Fitzgerald, Quantum Theory and the “Barbell Approach” by James Rickards
GoldReporter.de - Report: Fed prevented collapse of the New York gold trading
INFO~GRAPHIC : Visual Capitalist - 6 Factors That Influence Exchange Rates
LawrieOnGold - Currencies moving against gold rather than vice versa
Daily Advocate - Two bills in the Ohio General Assembly would once again make the sale of investment metal bullion and coins tax exempt in the Buckeye State.
CoinNews - 2015 Battle Of The Coral Sea Silver Bullion Coin Launches
Coin Update - Royal Mint Lunar Year of the Ram Silver Bullion Coins with Privy Marks
06/09/2015 - Bullion News
The Daily Reckoning - Good Evening, Mr. Bond by James Rickards "I recently had dinner in my hometown of Darien, Connecticut, with one of the best sources on the inner workings of the U.S. Treasury bond market."
CoinNews - Gold Gains, Silver Dips; US Coins Jump
Bullion Vault - China's Gold & the Lavender Hill Mob
CHARTS : Gold-Eagle - Fear And Loathing In The Precious Metals Markets
Market Watch - Opinion: This bear market in gold still has too many bulls
Court House News - Silver 'Rounds,' Not 'Coins,' Dealer Says : A Federal Class Action Claims Coin Manufacturers Advertise and Sell Knockoff Silver Coins Without Marking Them as Copies - Andrew Roseman sued BGASC LLC, Jet Bullion Corp. and Golden State Mint on Friday in Federal Court.
TECHNICAL ANALYSIS : Clive Maund - Gold Market Update
TECHNICAL ANALYSIS : Clive Maund - Silver Market Update
CATO Institute - Iceland: Hayek Got It Right
TECHNICAL ANALYSIS : TheGoldandOilGuy - Time to Move Capital into Next Bull Market – Part I
The Sovereign Investor - The Fed Is Trapped
Perth Mint Research - 12 reasons to not own gold: Part 1
CHART : National Inflation Assoc. - Why the S&P 500 is About to Roll Over
Cobden Centre - Seth Lipsky’s The Floating Kilogram, “The Federalist Papers For A Gold Standard”
The Bullion Desk - More banks to join gold price benchmark in ‘coming weeks’ – IBA
06/08/2015 - Bullion News
The Speculative Investor - Gold isn’t cheap, but nor should it be
TECHNICAL ANALYSIS : Kitco - Gold Develops Minor Short Term Bottom
Numismatic News - How much gold in China? - by Pat Heller
Money Morning - How You Can Tear a Page from the Inflation King’s Playbook by James Rickards
The Deviant Investor - National Debt – Or 1 is Too Many and 12 are Not Enough
GoldReporter.de - Jordan buys gold, Venezuela repels fonds - Google Translation Link
Dollar Collapse - What Would Happen If Mainstream Investors Discovered Gold?
TECHNICAL ANALYSIS : Kimble Charting - Dow Theory concerns would increase if this takes place
NANO-TECH : Huffington Post - World's Tiniest Spirals Could Help Thwart Counterfeiters
KARAR (Turkey) - James Rickards - "Europe has made growth theft from the US" - Google Translation Link
Christian Science Monitor - Ancient trade route shows gold's enduring power
Globe News Wire - A-Mark Precious Metals Joins the Fortune 500
06/07/2015 - Bullion News
Market-Ticker - Armstrong Is A Fool
Richard W. Fisher, Alan Greenspan, and Lawrence B. Lindsey
GRAPHICS : Zero Hedge - 103 Years Later, Wall Street Turned Out Just As One Man Predicted
Daily Reckoning - Three Catalysts for the Price of Gold by James Rickards
Wealth Daily - Easy Money Bubble
Epoch Times - Texas Wants to Build Gold Storage Facilities, Has Potential to Uproot Monetary System
The Hindu - Will India's New Gold Monetisation Scheme Glitter?
06/06/2015 - Bullion News
Peak Prosperity - As Goes The Credit Market, So Goes The World
Sunshine Profits - Greece’s Current Problems
International Man - A Brief History of Currency Wars
Metal Miner - Platinum, Palladium Price Forecast Survey SAYS?!
CHARTS : Market Update - Switzerland Exports Again Lot of Gold to Asia
VIDEO : CNBC - Rick Santelli: Economic Engine Still has Problems
CoinNews - Gold Falls for Third Week; US Mint Bullion Sales Rally
KTAR News - The truth about buying gold
SRSrocco Report - Canadian Silver Maple Leaf Sales Hit New Record Q1 2015
PHOTO : Zero Hedge - "The Simplest Way To Describe Keynesianism" In One Photo
The Speculative Investor - Worry about capital controls, not gold confiscation
Daily Mail - Count your pennies! Thrifty Chinese man saved £70,000 in COINS to buy a new car - and ordered a truck to send the money over
06/05/2015 - Bullion News
CEO.CA - How To Be Mentally Strong
Mish's Blog - Solid Jobs Report: Labor Force +397K, Establishment +280K Jobs, Employment +272K, Unemployment +125K, Unemployment Rate +0.1%
CHARTS : Alhambra Investment Partners - Payroll Stats Become Even More Implausible
TECHNICAL ANALYSIS : Kimble Charting - Bonds Could Be in Big Trouble if this Gives Way
CHARTS : dshort - Treasury Yields in Perspective
The Deviant Investor - Debt and the Tinderbox
COIN SCAM : CoinWeek - Telemarketer uses High-pressure tactics used in coin collection scheme
Bullion Vault - Talking Turkey on Gold
Bloomberg - Gold Demand at Perth Mint Slumps to Three-Year Low in May
CHART : Perth Mint Blog - Monthly Sales - May 2015
CoinNews - Blue Ridge Parkway Quarter Ceremony, Coin Exchange and Forum
GoldCore - Gold At $64,000 – Bloomberg’s ‘China Gold Price’
BullionStar - Media Failure On Russia’s Official Gold Reserves
Sprott Money - Dropping Money From Helicopters Being Entertained, We’ve Officially Gone Over the Deep End
Daily Reckoning (USA) - Awaiting a Paradigm Shift by James Rickards
06/04/2015 - Bullion News
Daily Reckoning (Australia) - Why Most Pundits are Dead Wrong About China’s Gold (10,000 tons is not enough) by James Rickards.
Daily Reckoning (USA) - Gold Prices Can Go One Of Two Ways – Either Way, You Can Profit by James Rickards
Calculated Risk - Preview: Employment Report for May - Mostly Positive Forecast of Friday's Jobs Report
KingWorldNews - This Is What Is Really Happening In The United States And What Surprise To Expect This Friday - Mostly Negative Forecast of Friday's Jobs Report
dshort - Anticipating the Employment Report for May - Neutral Forecast of Friday's Jobs Report
Kitco - Gold Remains A Safe Haven Despite Lower Demand – UBS
MineWeb - Gold tumbles out of Favour
CANCER RESEARCH : NewsWatch - Graphene Nanoparticles Could Be The Cure We Have Been Waiting For
Perth Mint Research - 12 reasons to own gold now: Part 2
VIDEO : Bloomberg - El-Erian: Surprised at Lagarde's Fed Comments
Sputnik - Russia to Increase Its Gold Reserves – Central Bank Head
TECHNICAL ANALYSIS : CEO.CA - This Could be the Trade of the Year
Royal Mint - GOING FOR GOLD - The Royal Mint unveils Signature Gold
06/03/2015 - Bullion News
PDF : Merk Investments - Outlook on Dollar, Currencies & Gold
CoinNews - Gold Falls to 3-Week Low; US Coin Sales Gain
Perth Mint Research - 12 reasons to own gold now: Part 1
TECHNICAL ANALYSIS : SOLARCYCLES - The Influence Of The Solar Maximum
VIDEO : CNBC - Weak economies don't have 'cushions': Stephen Roach
CHARTS : National Inflation Assoc. - NYSE Margin Debt/GDP Explodes Past Dot-Com Bubble Peak!
VIDEO : Kitco - USD Is Weaker, Why Isn't Gold Reacting? - Jim Wyckoff
Market Watch - Opinion: The dollar as a safe haven is a ‘fact that is not a fact’
Perth Mint Blog - Gold Prices In Aussie Dollars
Market Anthropology - Game of Loans
GoldBroker - Silver: Commodity or Money?
GoldReporter.de - When Jim Rogers would sell his gold ...

Affiliate Ad
06/02/2015 - Bullion News
TECHNICAL ANALYSIS : Money Morning - A Positive Technical Case for Silver is Getting More Compelling
Resource Investing News - Could Platinum Be Made a Reserve Asset?
Perth Mint Blog - 2015 Battle Of The Coral Sea Silver Coin Available Now
Silver Coins Today - 2015 Silver Eagle Rationing Ends as Demand Slows (Comparison Chart : American Silver Eagle Bullion Coin Sales 2014-2015)
VIDEO : Hedgeye - McCullough: Why Carl Icahn Is Absolutely Right to Be Worried About the Market
VIDEO : CNBC - Dollar Bull Run had its Day
CHARTS : Zero Hedge - Dollar Flash-Crashes On Sudden EUR Spike Amid Carnage In Bunds
CANCER RESEARCH : News-Press - Cancer treatments are inching toward market
King5 - The Little-Known Story of the "Fort Knox of Silver"
Bullion Star - US Government Lost 7 Fort Knox Gold Audit Reports
AUDIO : Gordon T Long - Interview w/ Jim Rogers
International Man - The End of the Safe Deposit Box for Wealth Storage
Dallas Observer - Texas Is Getting Its Very Own Bullion Depository
GRAPHIC : Sputnik - No More Dollar
Cobden Centre - How Government Inaction Ended the Depression of 1921
06/01/2015 - Bullion News
The Speculative Investor - The ‘Great’ Gold Debate
CountingPips - The Right Mentality: 7 Things to Consider When Buying Precious Metals
CoinNews - US Mint Sales of American Eagle Bullion Coins Fall in May
Numismatic News - Do coin shops have a future?
TECHNICAL ANALYSIS : Kitco - A Positive Possible Future for Gold
TECHNICAL ANALYSIS : GoldSeek - Gold Sector, Big Picture
CHARTS : National Inflation Assoc. - Gold vs Stocks During Hyperinflation
Mish's Blog - Default and Get it Over With; Stop the Needless Torture
Zero Hedge - Chart Of The Day: It's Worse Than 2000!
The Deviant Investor - Bikers, Bonds, and Black Swans
Star-Telegram - A gold rush in Texas?
Reuters - Platinum sector faces its Kodak moment in fuel cell technology
AUDIO : King World News - Interview about the Financial Markets with Felix Zulauf
Owning Gold - Gold seems to have lost its narrative.
05/31/2015 - Bullion News
Project Syndicate - The Liquidity Time Bomb by Nouriel Roubini
AUDIO : Financial Sense - Jim Puplava’s Big Picture: San Andreas – Financial Fault Lines in the Bond Market
Wall Street Pit - Jim Puplava Interviews Frank Holmes about the Gold Market and Why this Gold Bear Market Is Different
Bloomberg - A Six-Lane Freeway of $100 Bills Is Tormenting Credit Investors
TECHNICAL ANALYSIS : Kimble Charting - S&P 500 – Is it repeating the 2000 & 2007 topping pattern?
Zero Hedge - "The Fed Has Been Horribly Wrong" Deutsche Bank Admits, Dares To Ask If Yellen Is Planning A Housing Market Crash
BullionStar - Will The Renminbi Be Fully Convertible In 2015?
GoldBroker - G7 Agree in Principle to Add Chinese Currency to IMF's SDR Basket
Free Market Cafe - The Chinese “Buy Signal” on Gold
AUDIO : Sovereign Man - Family Counts More Than Anything Else
The Deviant Investor - Lunch With Elvis
TECHNICAL ANALYSIS : SOLARCYCLES - Debt And Demographics Dictating
VIDEO : Wall Street Week - Interview with Carl Icahn, Part 2
Business Insider - ROBERT SHILLER: 'There is a bubble element to what we're seeing.'
Hedgeye - CHART OF THE DAY: U.S. Debt
CMI Gold and Silver - IMF tells Japan to print more
05/29/2015 - Bullion News
The Sovereign Investor - Is Gold the Anti-Dollar?
CHARTS : dshort - NYSE Margin Debt Hits a New Record High
CHARTS : Zero Hedge - Margin Debt Breaks Out: Hits New Record 50% Higher Than Last Bubble Peak
The Wall Street Journal - Narayana Kocherlakota (Federal Reserve Bank of Minneapolis President) : ‘Mistake’ for Fed to Raise Rates in 2015
Wealth Daily - What the Fed Doesn't Know CAN Hurt You - The Fed Can't See the Future
CEO.CA - 4 Troubling Charts
Sunshine Profits - Gold in Different Currencies
GOLD NANO-PARTICLES : MOTHERBOARD - This Gold Nano-Slinky Is a Cancer-Detecting Hyperlens
The Bullion Desk - Gold has muted response to slowing US economy
CoinNews - US Mint to Lift 2015 American Silver Eagle Rationing
Market Watch - Gold futures score first monthly gain since January
SRSrocco Report - GERMAN GOLD BUYING: A Chart You Have To See
Kitco - The Royal Canadian Mint Sees Increase In Gold, Silver Bullion Sales But Lower Revenues In Q1
VIDEO : CNBC - Regulations are Killing Small Businesses and Small Banks
Investor's Business Daily - The Best Gifts For College Graduates by Thomas Sowell
05/28/2015 - Bullion News
Daily Reckoning - The Dollar Will Die with a Whimper, Not a Bang
VIDEO : CNBC - A Golden Opportunity?
FAKE BULLION ALERT : CoinWorld - Counterfeit American Eagle gold bullion coins improving in design quality
The Bullion Desk - Palladium market to remain in deficit as Russian shipments decline – Barclays
Bloomberg - American Car Sales Lure Cash Back to Funds Betting on Palladium
Bullion Vault - Bitcoin, BitGold, GoldMoney - and BullionVault
SILVER NANO-PARTICLES : Tech Fragments - Silver Nanoparticles Antibacterial Activity Holds Promise
Numismatic News - Bullion sales continue to slump
Market Watch - Opinion: Gold can glitter if stocks hit the rocks
Casey Research - The Message from Last Week's Headlines: Don't Sell Your Gold
The Deviant Investor - Gold Has Bottomed – More Evidence
Acting Man - Government – Designed for Robbery
Bonner & Partners - U.S. House Prices Back to Pre-Crisis Levels
Daily Reckoning - When Genius Fails Again, Part III
PHOTO : Perth Mint Bullion - Spectacular 10 Kilo Silver Coin Marks Year Of The Goat
VIDEO : WZZM13- Could the lost Confederate gold treasure that was stolen after the Civil War be buried somewhere in northern Lake Michigan?
05/27/2015 - Bullion News
05/27:"The Whold Currency Market Now is Basically Pro-Dollar / Anti-Dollar Trade"....Watch Friday's GDP Report to Get an Idea of Which Way the Dollar & Gold will Move VIDEO : CNBC - The Dollar Conundrum
TECHNICAL ANALYSIS : Market Anthropology - Currencies at a Crossroads
Alhambra Investment Partners - Two Years Later: Gold Was Right About The ‘Dollar’ As Economists Should Have Been Far Less Giddy About It All
Zero Hedge - Why Russia Is On A Gold Buying Spree
Market Watch - China sets up giant gold fund to expand its market power
CHARTS : GoldSilverWorlds - Palladium Holding Up Better than Gold
Confounded Interest - Home Prices Grow At 5.04 Percent YoY As Wage Growth Remains Stagnant (Mortgage Purchase Applications Have Already Peaked)
International Man - The Fed Steals from Retirees and Savers—Do This Before They Take Even More
Money Morning - Don't Drown in the Sea of Global Debt
05/26/2015 - Bullion News
Perth Mint Research - Insurance – Do We Really Need It?
Silver Monthly - 13 Secret Tactics of Bullion Dealers
BullionStar - Don’t Believe Everything You Read On The Internet
Free Market Cafe - Silver Isn’t Always a “Sell”
Bullion Vault - When Is the Best Time to Buy Gold?
AUDIO : Kitco - Greece Back On The Front Burner as U.S. Dollar Rallies
National Inflation Assoc. - A 100% Perfect Predictor of Stock Market Crashes
CoinWeek - New PCGS Holder To Protect Coins, Combat Counterfeiting
CoinWorld - ‘Gold’ a longtime synonym for ‘value’
The Deviant Investor - “Suicidal Credit-Based Money System”
GoldSeek - John Nash RIP: “Beautiful Mind” Game Theory May Lead to Gold Standard
Daily Reckoning - When Genius Fails Again, Part I
Daily Reckoning - When Genius Fails Again, Part II
Cobden Centre - Why Government Deficits And Debt Do Matter
GoldReporter.de - Australia has funded 7 per cent less gold
05/25/2015 - Bullion News
Have A Safe & Happy Memorial Day!
Give Thanks to Those Who Made the Ultimate Sacrifice for Our Freedom!
TECHNICAL ANALYSIS : Action Forex - XAU/USD (Gold) Is Refused By 200-Day SMA
TECHNICAL ANALYSIS : Trader Dan's World - Is The Silver Trade Getting Crowded?
AUDIO : Sprott Money - Ask The Expert - Bob Thompson
Money Morning - Another Crisis of Confidence in the US Dollar is Coming by James Rickards
Solidus Center - Busted Metals Traders Distract from Larger Manipulation Problem
CHARTS : National Inflation Assoc. - Global Stock Valuations Nearing Extreme Peak
The Bullion Desk - Above-ground platinum stocks unlikely to reach zero – WPIC
Market Watch - Platinum prices could see a pop even as deficit shrinks
GoldCore - China Creates Gold Investment Fund For Central Banks
GoldSeiten.de - Explaining a Cashless Economy - Google Translation Link
VIDEO : CNBC - Yellen not as hawkish as market thinks: Schlossberg
PDF : Federal Reserve - The Outlook for the Economy Remarks by Janet L. Yellen (Full Text)
05/24/2015 - Bullion News
SafeHaven - Gold Buried?
VIDEO : PhysicalGoldFund - Kyle Bass Comments on Taking Delivery of $1B in Physical Gold Bullion
SRSrocco Report - THE KEY FUTURE SILVER PRICE FACTOR: Investment Demand, Not Solar
Economic Times - Fall-off in weddings bodes ill for jewellers, gold
Business Insider - Five global banks just proved that no one can stop Wall Street from breaking the law
GRAPHIC : Zentrader - #1 Stock Market Concern This Memorial Day
VIDEO : The Next Big Trade - Are Corporations the Dumb Money of This Bull Market
The Speculative Investor - Comparing the Rates of Money-Pumping
CHARTS : Alhambra Investment Partners - Yellen Puts The ‘Dollar’ Back On Suicide Watch
Confounded Interest - The Low Velocity Economy (US Money Velocity At All-time Low)
AUDIO : Sovereign Man- Simon Black - The Fundamentals of the US Economy
Sputnik - More Russian, Chinese Companies Switching to Yuan Transactions – Bank
Economic Policy Journal - BREAKING: Greece Threatens June Bankruptcy
WhaTech - BitGold Inc. Announces Additional Information on the CAD 51.9 Million Acquisition of GoldMoney.com to Clarify Earlier Announcement - Includes GoldMoney's Annual Earnings for the Past 5years.
Free Shipping on Orders $199+ | 5.0 star Customer Reviews
05/22/2015 - Bullion News
VIDEO : Bloomberg - Fed Is Trapped, Painted Into a Corner on Rates : Whalen
CoinNews - Gold, Silver Drop on Week; US Mint Coin Sales Improve
AUDIO : PhysicalGoldFund - The Gold Chronicles: Interview with Jim Rickards
BullionStar - Kronen Zeitung: Austria Repatriates 110 Tonnes From UK
GoldSeek - COT Gold, Silver and US Dollar Index Report - May 22, 2015
CHARTS : dshort - What Inflation Means to You: A Look Inside the Consumer Price Index
Business Insider - Janet Yellen just made one of the most surprising admissions you'll ever hear from an economist
Mish's Blog - Yellen Yap: Point by Point Rebuttal
GoldSeek - ‘Titanic’ Global Economy May “Collapse” Warn HSBC – Gold Is Lifeboat
CHARTS : Hambone's Stuff - Reality Check - What Happens when a Ponzi Runs Out of New "Investors"
Perth Mint Research - Gold Price Forecasting, the Hard Core Academic Way
Secular Investor - Tick-Tack, the Greek time bomb is about to go off as the last meeting didn’t end well
CEO.CA - Bitgold buys GoldMoney
05/20/2015 - Bullion News
Bloomberg - Chinese Gold Standard Would Need a Rate 50 Times Bullion’s Price
TECHNICAL ANALYSIS : King One Eye - The US Dollar Bangs Its Head -- What's Next?
AUDIO : McAlvany Weekly Commentary - If you don’t OWN GOLD, you don’t know history
FAKE BULLION ALERT : GoldSeiten.de - Fake Gold & Silver - Exposing the Fake Silver & Gold Bullion Coming Out Of China
FAKE BULLION ALERT : Perth Mint Blog - Don't Get Duped By Fake Minted Bars
DollarCollapse - The End Is Near, Part 5: Paying Dividends With Borrowed Money
VIDEO : Zero Hedge - Ray Dalio Slams Buffett For Being "Wrong On Gold", Says "Social Disruption" Is Inevitable
CoinNews - 2015 Australian Wedge-Tailed Eagle Silver Bullion Coin Released
BullionStar - PBOC Gold Purchases: Separating Facts from Speculation
VIDEO : Kitco - Don't Expect Rate Hikes Until 2016 - Frank Holmes
The Deviant Investor - An Insane Financial World
Alhambra Investment Partners - Where Is This Housing Rebound?
05/19/2015 - Bullion News
CoinNews - Gold, Silver and Platinum Snap 5-Session Winning Streak
AUDIO : Link : Twitter - James Rickards Interview about the Financial war and more.
TECHNICAL ANALYSIS : Kimble Charting - Dr. Copper's Leading indicator faces Dual Kiss of Resistance
VIDEO : Hedgeye - McCullough: 'There's No Inflation, But It Costs $127,000 to Go to Harvard for Two Years'
VIDEO : CNBC - Bank of America Analyst - MacNeil Curry who called "Oil a Buy" in February of 2015, Now says Silver is going to $13.00
Equity Research - Examples of MacNeil Curry - BoA Analyst's past recommendations
MineWeb - Global platinum demand up, supply down
Secular Investor - Have you heard of India’s newest gold Ponzi-scheme?
GoldSeek - Q1 physical gold sales up 20% in Germany as gold price hits $1,233
Perth Mint Research - Today: War on Cash. Tomorrow: War on Gold?
GulfNews - Chinese tax authorities to audit all gold traders
MoneyBeat - Investors Turn To Gold ETF Options As Hedges
Casey Research - History Shows a Gold Bull Market Maybe Approaching
INFO~GRAPHIC : Visual Capitalist - The Lunar Gold Rush: How Moon Mining Could Work
05/18/2015 - Bullion News
Bloomberg - Bank of America: Markets Are in a 'Twilight Zone' and It's Time to Hold More Cash and Gold
VIDEO : Hedgeye - Keith's Macro Notebook 5/18: USD | Gold | Europe
VIDEO : CNBC - Santelli Exchange: The Fed's asset bubble machine
Casey Research - Buffett Takes a Page From the "Inflation King's" Playbook
SRSrocco Report - The Precious Metal Favored During A Financial Crisis Isn’t Gold
VIDEO : CNBC - El-Erian: Markets underestimating liquidity risk
CHARTS : dshort - Treasury Snapshot: With Equities at Record Highs, Where are Treasuries?
MineWeb - Platinum supply still in deficit but not as large – WPIC
Commodity Online - Platinum: India to remain key driver of global jewellery growth
Mish's Blog - Why Are Economists' Predictions So Damn Awful?
The Deviant Investor - Silver Price Projections For 2020
Motley Fool - What Is a Silver Certificate Dollar Worth?
GoldReporter.de - Gold Buy - Top 10 Tips - Google Translation Link
05/17/2015 - Bullion News
AUDIO : The John Batchelor Show - Interview with Seth Lipsky, Editor of The New York Sun and Author of "The Floating Kilogram" - A Discussion about the Debasement of the US Dollar
Alhambra Investment Partners - Let Them Eat Cake
Reuters - Central Banks Chase Investor Herd into Liquidity Trap
Investment Week - Inflation: The Elephant in the Room
TECHNICAL ANALYSIS : The Speculative Investor - The Gold Sector: Close, But No Cigar...Yet
Bonner & Partners - Why Most Gold Bugs Are Dead Wrong by James Rickards
CHARTS : BullionStar - SGE Withdrawals vs WGC Demand Q1 2015
Business Insider - Here's your complete preview of this week's big economic events
Thoughtful Cynic - Primary Risk #4: Dollar Debasement
Alhambra Investment Partners - Industrial Production Sinks As Capacity Signals Inventory End
CEO.CA - “Wrestling with Something Else”: Why this Gold Bear Market Is Different
Zero Hedge - The War On Cash Destroys A Small Entrepreneur
Rick Ackerman - A Few Simple But Powerful Ideas for Investors
CMI Gold & Silver - No Gold Price Manipulation
05/15/2015 - Bullion News
VIDEO : Zero Hedge - Ray Dalio: "If You Don't Own Gold, You Know Neither History Nor Economics"
TECHNICAL ANALYSIS : Daily Forex - Gold Encounters Resistance at $1225
GoldReporter.de - "With 30,000 tons of gold China could plunge the US dollar" - Google Translation Link
American Hard Assets - 7 Common Misconceptions About Gold
TECHNICAL ANALYSIS : Kimble Charting - Commodities hitting 25-year support line with few bulls!
TECHNICAL ANALYSIS : King One Eye - The US Dollar Tests Longer-Term Support
VIDEO : CNBC - Santelli Exchange: Word of caution
TECHNICAL ANALYSIS : SOLARCYCLES - On The Attack
CoinNews - Perth Mint Bullion Sales Ease in April
Sputnik - Inflation Fears, Grexit and Ukraine Crisis Trigger New European Gold Rush
Profit Confidential - Gold Demand Report: Central Banks Remain Buyers
PDF : The Gold Standard Institute - The Journal ● Issue #53
The Deviant Investor - House of Cards – Will It Collapse?
Perth Mont Blog - Why buy gold?
Economic Policy Journal - The Squeeze: Gas Taxes State by State
05/14/2015 - Bullion News
Notes from Underground - Is There Something Bigger Bothering the Bond Markets?
TECHNICAL ANALYSIS : Trading Floor - Old Gold Bugs Beware – We've Been Here Before
World Gold Council - Global gold market remains steady in Q1 2015 demonstrating the unique diversity of gold demand
MineWeb - Scotia: Gold ‘cheap’ safe haven
MoneyBeat (WSJ) - Facing Reality: GDP Looks Like It Will Fall Short… Again
The Mess That Greenspan Made - A Recession Without Room to Cut Rate?
Market Watch - Gold futures score highest settlement in 3 months
CHARTS : StreetTalk - Riddle Me This: The Difference Between Headlines And Reality
The Telegraph - Epic global bond rout is a QE success story - but it won't last
VIDEO : CNBC - Chris Whalen, Kroll Bond Rating Agency, warns of a looming liquidity crisis.
Sovereign Man - Even the FDIC doesn’t think it’s ready for the next banking crisis
Finance and Economics - The Trouble with Cash by Alasdair Macleod
The Telegraph - Germans Pile into Gold Amid Greek Eurozone Default Fears
PHOTOS : Zero Hedge - This Is What $800 Million In Ten Pieces Of Art Looks Like
gbTribune - Texas man discovers hidden treasure in estate sale chest
Resource Investor - Seized gold bars turn out fake

05/13/2015 - Bullion News
CANCER RESEARCH : GoErie - Human Trials on Kanzius Device to Begin in Italy
VIDEO : CNBC - Santelli Exchange: US Economy Mediocrity
TECHNICAL ANALYSIS : Kimble Charting - Silver Breaking Above 2015 Falling Resistance!
CHARTS : Alhambra Investment Partners - The Recovery Itself Unravels; Consumer Recession
Business Insider - HSBC WARNS: The world economy faces a 'titanic problem'
AUDIO : McAlvany Weekly Commentary - Today’s Smart Money? – “Gold, Cash & Patience”
TECHNICAL ANALYSIS : CEO.CA - The Most Important Chart Right Now
Business Standard - Is it time to shift to gold?
Gold-Eagle - What Might Be Behind Today’s Gold Price Jump
National Inflation Assoc. - Euro Area Inflation is Exploding
Bloomberg - Market Moves That Are Supposed to Happen Every Half-Decade Keep Happening
Zero Hedge - Bond Manager Suggests "Make Cash Illegal" To End Boom & Bust
SRSrocco Report - Why Is The U.S. Importing So Much Silver Bullion??
MyDigitalFC - India Surpasses China in Silver Coin Fabrication
BullionStar - China’s Silk Road Economic Project Will Include Gold
05/12/2015 - Bullion News
The Speculative Investor - ASS Economics
TECHNICAL ANALYSIS : DailyFX - USDOLLAR-Breakdown Risk While Under 11828
Silver Coins Today - 2015 Kisatchie 5 Ounce Silver Bullion Coin Sells Out
CHARTS : GoldReporter.de - What Reveals the Short Position of US Banks on the Gold Price - Google Translation Link
VIDEO : CNBC - The market is doing something extremely rare: Top Technician
CoinNews - Gold Climbs, US Mint Sales Log Wide Gains
AUDIO : The Goddard Report - Why are China and Russia dumping their US Treasuries? : Interview with Chris Vermeulen
Bloomberg - Euro Passes Dollar in Russian Reserves for First Time Since 2008
GOLD NANO-PARTICLES : U.S.News - Cancer-Fighting Harvard Student Looks to a Future in STEM
The Mess That Greenspan Made - U.S. Debt and Equities Since 1981
Daily Reckoning - Fairytales from the Federal Reserve: 15 Reasons Fed Policies Belong in Fantasyland by Jim Rickards
Economic Policy Journal - Fed Has Emergency Plan to Intervene if U.S. Defaults on Debt
CHARTS : Hambone's Stuff - The Fed's Backdoor QE - Central Bank Currency Swaps?
Numismatic News - Pat Heller of Liberty Coin Servic Offers his Thoughts on the Recent Economist's Article on Gold
Perth Mint Research - Dark Gold
Zero Hedge - Is This Company's 74% Surge In The Past Week Confirmation That Grexit Is Imminent?
05/11/2015 - Bullion News
MorningStar - How to Get the Most Out of Your Bullion-Buying Buck
CoinNews - Precious Metals Move Lower; US Silver Coins Rise Slightly
TECHNICAL ANALYSIS : Kimble Charting - Interest rates “Blowing Through Resistance!”
CNBC - Bond yields spike, market looks for capitulation
Counting Pips - Why Your Investment Portfolio Probably Isn’t as “Diversified” as You Think
GOLD NANO-PARTICLES : Gizmodo - Nanotechnology has cure for critical diseases like Ebola and Cancer
MineWeb - Slipping gold reserves - a look at proven and probable reserves of the top five gold miners
Perth Mint Research - Goldbugs, Silverbugs, or Balancedbugs: Sales Ratios
Perth Mint Research - Goldbugs, Silverbugs, or Balancedbugs: Sales Ratios
The Telegraph - Silver no longer the poor man’s gold as solar demand surges
Global Financial Intelligence - Interview with Silver Guru - David Morgan - Google Translation Link
FOFOA - Clean Float – Why the Dollar Must Collapse
VIDEO : SafeHaven - Gordon T Long: Risk and Wealth Preservation with Egon von Greyerz
Forbes - China Goes After Dollar With Gold Fix
The BRICS Post - India announces first BRICS Bank President
05/10/2015 - Bullion News
IBTimes - Gold Prices: Bullion to Benefit from Likely Financial Markets Volatility
Nichols on Gold - Waiting for the Start of Something Big
VIDEO : News Moving Markets - Bill Gross "Central Banks are Gaming Asset Prices"
Bloomberg - Schaeuble Says Greece Playing Chicken With Default Risk
FORTUNE - Bold Gold Jewelry is Back in Style
CHARTS : StreetTalkLive - 4 Charts: Why Fed Unlikely To Raise Rates In 2015
CHARTS : Zero Hedge - Chart Of The Day: Record Stock Buybacks Hit Escape Velocity
National Inflation Assoc. - Global Bond Bubble Showing Signs of Bursting
Twitter - James Rickards thoughts on China's Rate Cut
Independent (Ireland) - How to keep your wealth from the hands of thieves
Inside Futures - Excellent Trading Theory
Economic Policy Journal - This is How Government Backed Education Debt Works
Daily Pfennig - Where Will Gold Be At The End Of 2015? Survey Results Are In
05/09/2015 - Bullion News
AUDIO : Financial Sense - Jim Puplava’s Big Picture: Gold: Past, Present & Future – Featuring Frank Holmes, Ross Hansen and John Doody
The Speculative Investor - Large Sums of Cash are Hot Potatoes
CoinNews - Gold Snaps Weekly Losing Streak; US Mint Coin Sales Mixed
NewsMax Finance - Fewer Jobs, Strong Dollar Put Yellen in an Awkward Corner
Zero Hedge - Why There Is No Treasury Liquidity In One Chart
GoldSilverWorlds - Weekly Gold Market Review With 4 Amazing Charts
Free Market Cafe - Seven Years of Famine for U.S. Stocks
Federal Reserve of NY (Blog) - Crisis Chronicles: The Man on the Twenty-Dollar Bill and the Panic of 1837 - The NY Fed's view of Andrew Jackson and "Hard Money"
PHOTO : Twitter - Gold Standard Inst: When rock DOES beat paper!
GoldCore - ‘The Economist’ Anti-Gold Article – Case Study in Disinformation
The Daily Star - Gold Treasure in Mountains
05/08/2015 - Bullion News
Profit Confidential - Mayweather Pacquiao Fight and the Declining Value of the U.S. Dollar
The Bullion Desk - Gold inches towards $1,200/oz as lukewarm jobs report maintains status quo
Mish's Blog - Establishment +233K Jobs; Household +192K Employment, Part-Time Employment +198K, Labor Force +166K
Alhambra Investment Partners - Payroll Friday Strikes Again
AUDIO : Mises Institute - James Grant: The Forgotten Depression
SWI swissinfo - Counting Gold in Switzerland
The Silver Institute - Key Components of Global Silver Demand Rose in 2014
Scrap Monster - Silver market deficit plunged 95% in 2014
CHARTS : Hambone's Stuff - Veneer of US Growth & Normalcy Has Worn Paper Thin...Reality Plainly Visible Through the Fraud
CHARTS : National Inflation Assoc. - NYSE Margin Debt at Extremely Dangerous Levels
AUDIO : Peter Schiff - The April Jobs Report and My Encounter With Ben Bernanke
The Deviant Investor - Dollar Danger Zone
Zero Hedge - Japan National Debt Rises To 1,053,357,200,000,000 Quadrillion Yen or 8,792,154,015,218.45 Trillion US Dollars
Daily Mail - Is this bar of silver the lost treasure of Captain Kidd? Ingot was part of legendary pirate's booty, say archaeologists, after discovering it off the coast of Madagascar
CoinWeek - Breaking News: ModernCoinMart Sold to Asset Marketing Services
Tenth Amendment Center - Texas Bill to Establish Bullion Depository, Help Facilitate Transactions in Gold and Silver, Passes House 140-1
05/07/2015 - Bullion News
TECHNICAL ANALYSIS : TheGoldandOilGuy - Investor Focused Market Analysis
CoinWorld - U.S. Mint resumes sales May 4 for 2015 Kisatchie National Forest 5-ounce silver bullion quarter dollars
Notes from Underground - Notes From Underground: Yellen, Draghi and the Markets … Playing Those Mind Games Together
CHARTS : GoldBroker - Big Picture View of the Dow/Gold Ratio
TECHNICAL ANALYSIS : Kimble Charting - Whack a mole time for key assets of late! Now what???
American Hard Assets - 15 Precious Metals Terms All Gold Buyers Should Know
GOLD NANO-PARTICLES : Orlando Sentinel - UCF team uses gold nanoparticles to detect cancer risk
TECHNICAL ANALYSIS : Inside Futures - Interest Rate Conundrum Resolution
BullionStar - China tests yuan gold fix process amid pricing ambitions: sources
BullionStar - Biggest Newspaper Netherlands Interviews Koos Jansen
The Deviant Investor - Can Gold Save the World From the Credit Bubble?
Perth Mint Research - Returns Matrix for USD & AUD and Gold & Silver
AUDIO : Mises Media - David Stockman: Against Crony Capitalism, Part 2
Solidus Center - Repatriation of Gold from Fed Suggests Historic Vote of No Confidence
Casey Research - Game-Changer for Gold?
05/06/2015 - Bullion News
Notes from Underground - If Gross, Gundlach and Even Buffet Are Correct, Then THE FED IS WRONG
AUDIO : McAlvany Weekly Commentary - Harvard Economist: “Eliminate ALL Paper Money!”
Bullion Vault - The Investor's Answer to QE
SafeHaven - What's Next for The Dollar and Currencies? by Axel Merk
Reuters - Spot gold trading shrinks as interbank deals dry up
Market Watch - Chinese demand for silver bullion bars halved last year
CHART : dshort - ADP Employment Report for April Disappoints Expectations
Yahoo Finance - USDOLLAR Index Exhibiting Tendency of a Bearish Market
TECHNICAL ANALYSIS : Kimble Charting - Is the Fed losing control of interest rates?
The Speculative Investor - The shrinking central-bank reserve stash
Investment U - The True Cost of Low Interest Rates
VIDEO : Fox Business - Mohamed El-Erian on liquidity concerns
Perth Mint Research - 45 year Returns Matrix for Gold
ZeroHedge - Gold Withdrawals From NY Fed Vault Refuse To Stop: 200 Tons Of Gold Repatriated In Past Year
GoldSilverWorlds - Ted Butler: Silver’s COT Report Turns Bullish
SPACE - Asteroid-Mining Company to Deploy 1st Satellite This Summer
05/05/2015 - Bullion News
Numismatic News - Out of Cash?
Perth Mint Research - Outlook for gold: positive and negative factors
Reuters - Dollar falters as mixed U.S. data clouds rate outlook
Daily Reckoning - Buffett Takes a Page From the “Inflation King’s” Playbook
CoinNews - Gold, Silver Mark 2-Day Rise; US Coin Sales Gain
CHARTS : dshort - Market Valuation, Inflation and Treasury Yields: Clues from the Past
TECHNICAL ANALYSIS : CEO.CA - The Moment of Truth for Bonds
Bullion Vault - 2015 Gold Sentiment Upturn Continues
PHOTO : Baylor College of Medicine - Image of the Month: Carbon Nano-Tubes as Cancer-Fighting Tools
Free Market Cafe - A Tsunami of Gold Buying
GoldBroker - The SDR, Gold and China
Secular Investor - Is the USA manipulating its own currency before an important IMF meeting?
VIDEO : CNBC - Santelli Exchange: Have interest rates bottomed?
CHART : National Inflation Assoc. - US Overtaxation Crisis Imminent
Bullion Baron - Martin Armstrong on Australia's Bank Deposit Tax
Business Insider - FED CHAIR YELLEN: In 2012, I met with a research firm that later leaked details from an FOMC meeting
Free Shipping on Orders $199+ | 5.0 star Customer Reviews
05/04/2015 - Bullion News
SafeHaven - The Collapse of Cash by Michael Pento
GOLD NANO-PARTICLES : News-Press - Kanzius Cancer Funds coming to Lee Memorial - Includes information about possible Human Trials...
Perth Mint Research - Silver investors corner the market, not JP Morgan
TECHNICAL ANALYSIS : Clive Maund - Gold Market Update
TECHNICAL ANALYSIS : Clive Maund - Silver Market Update
TECHNICAL ANALYSIS : The Deviant Investor - Silver and NASDAQ – Long, Medium and Short Trends
CHART : Perth Mint Blog - The Perth Mint's April 2015 Gold and Silver Sales
TECHNICAL ANALYSIS : Next Big Trade - Is Gold Moving out of its Bear Market?
Zero Hedge - WSJ Slams Bernanke's Blog Post: "Stop Blaming Everyone" For Your Mistakes
TECHNICAL ANALYSIS : Market Anthropology - Macro Market Musings for May
VIDEO : CNBC - Red flags in bull market
The Telegraph - Liquidity drought could spark market bloodbath, warns IIF
VIDEO : Wall Street Week - Interview with Carl Icahn
CHARTS : dshort - Regression to Trend: A Perspective on Long-Term Market Performance
Free Market Cafe - Guilty of Loving Too Much
05/03/2015 - Bullion News
BlackRock - Would More Government Debt Help the U.S. Economy?
CHARTS : SoberLook - By insisting on a rate hike the Fed has "imported" some of the global slowdown
Alhambra Investment Partners - A Considerable Transitory Period
Dollar Collapse - Why Equity Investors Should Be Terrified, In One Chart
SafeHaven - The U.S. Government: Adding Illiquidity to Insolvency
AUDIO : Peak Prosperity - Joe Saluzzi: Broken Markets
GOLD NANO-PARTICLES : Goo4Info - Gold Nano-Particles Intensify Cancer Killing Radiation
Secular Investor - China and its Secret Gold Reserves
Zero Hedge - China's True Gold Holdings To Remain A Secret After All
Sputnik - US Financial Analyst Predicts Inevitable Collapse of US Economy
LINK : Twitter - James Rickards - IMF has such a way with words. Capital controls are now "Capital Flow Management." Both mean "we keep your money."
GRAPHIC : Business Insider - Here's how much income is taxed around the world
Ancient Origins - Finnish Archaeologists find Wreck of 15th Century Ship Laden with €50m Worth of Treasure
05/02/2015 - Bullion News
Global Financial Intelligence - There Remains a Shortage of Gold
- Google Translation Link
CoinNews - Why did the Bank of International Gold and Silver Split on Week; US Gold Sales Hit 6-Week High
AUDIO : Finance & Liberty - David Stockman: Against Crony Capitalism, Part 1
arabian money - Why did the Bank of International Settlements just slam the gold price down with a $590m sale?
Miami Herald - FBI: More million-dollar gold bars, stolen in highway heist, may be in Miami
VIDEO : LMRT - Nanoparticle Transport in Tumors - Short Version
Zero Hedge - The US Equity Bubble Depends On Corporate Buybacks; Here's The Proof
Market Watch - What happens if the Fed is too late raising rates?
BloombergView - Bank of Japan Parts Ways With Reality
The Independent - Greek pensioners start bank runs after payments delayed
Times of India - Hyderabad Airport is gold smugglers favourite
Economic Policy Journal - What McDonald's is Doing as the San Francisco Minimum Wage is Increased to the Highest the Land
05/01/2015 - Bullion News
CHART : Perth Mint Research - 10 year Price vs Sentiment Map for Gold
Reuters - CME Group suspends two gold futures traders for allegedly spoofing
CNBC - Santelli Exchange: Net float sink
The Street - Friday, May 1: Today in Gold and Silver
Project Syndicate - The Dollar Joins the Currency Wars
WallStreetExaminer - China Gold Reserves to Be Revealed After 6 Years of Secrecy
The Washington Times - Russia is hoarding gold; you should worry
The Telegraph - US jobs relapse raises fresh doubts on Fed tightening
SRSrocco Report - U.S. GOLD EXPORTS IN 2014: Surged During Price Take-downs
The Deviant Investor - Silver – Four Years Later
AUDIO : The Goddard Report - Interview with Danielle Park : Big Business and Government, Too Cozy
Zero Hedge - Auto Sales Drop, Miss For 5th Month In A Row; Worst Year-To-Date Performance Since 2009
CHARTS : Hambone's Stuff - Manufacturing Recovery or Manufactured Recovery?
The Speculative Investor - The sort of analysis that gives gold and silver bulls a bad name
SURVEY : Perth Mint Blog - The Perth Mint Wants to Hear from You...
04/30/2015 - Bullion News
Casey Research - These Three Developments Say New Mine Supply is Peaking
Daily Reckoning - James Rickards : Beware the Money Illusion Coming to Destroy Your Wealth
CHART : Twitter - Eddie van der Walt - What in the world is up with gold? BAM! Up to $1,210. BAM! Back down to $1,180. Over and over.Like watching pingpong.
TECHNICAL ANALYSIS : CFD Trading - Bearish Momentum Picking Up on Gold (XAUUSD)
Monetary Metals - Think Different About Purchasing Power
Perth Mint Research - Who buys or sells does matter
CHARTS : Zero Hedge - Dollar Suffers Worst Month In 4 Years - Ends Record Streak Of Gains
VIDEO : JM Bullion - Silver & Gold Dealer Hedging
VIDEO : Kitco - Gold Buying Opportunity Has Still Not Come - Jim Rogers
Reuters - India brushes off concerns over gold import spike - for now
The New Indian Express - Gold Smuggling on the Rise at Airport
The Deviant Investor - With a Bang or a Whimper (How the Financial World Resets)
TECHNICAL ANALYSIS : Kimble Charting - S&P repeating 2000 and 2007 pattern right now?
Thoughtful Cynic - Our Current Economic Woes- Part 3: So What Do We Do?
Finance and Economics - Alasdair Macleod : Why deflation is unlikely
CHARTS : dshort - Real Disposable Income Per Capita Declined Fractionally in March
04/29/2015 - Bullion News
VIDEO : CNBC - Rick Santelli reports on the U.S. 10-year yield going above 2%. Lack of liquidity is a big issue
CoinWeek - BREAKING NEWS: Kisatchie National Forest 5 Oz. Silver Bullion Coin Temporarily Sold Out
INFO~GRAPHIC : JM Bullion - Gold and Silver Dealer Hedging
CHARTS : StreetTalkLive - Margin Debt: A Variety Of Measures Suggest Caution
VIDEO : Kitco - Rick Rule Reacts To Wednesday's Fed Announcement
Mish's Blog - Real Q1 GDP 0.2% vs. Consensus 1.0%; Disaster in the Details
Hambone's Stuff - So Simple Even An Economist (Or A Fed Chairman) Could Get It?!?
AUDIO : McAlvany Weekly Commentary - Preparing for Global Currency Reset
Secular Investor - Fear of Grexit Will Push Gold To $1,400 This Year
VIDEO : CNBC - Fed statement awfully familiar: James Grant
Twitter - Jim Rickards : Spoke to guy who wrote 20 #Fed statements.
TECHNICAL ANALYSIS : Free Bullion Investment Guide - 1st Quarter - 2015 Charts, Bullion News & Commentary
VIDEO : Silveready 1 - EASY FAKE SILVER EAGLE TEST - IT WORKS!!!
VIDEO : People - There's an Actual Treasure Chest Full of Gold and Jewels Hidden Somewhere in New Mexico
Affiliate Ad
04/28/2015 - Bullion News
Marc to Market - Two Observations on US Corporate Earnings
TECHNICAL ANALYSIS : King One Eye - Is Doom Nigh for the US Dollar? Chart!
TECHNICAL ANALYSIS : Kimble Charting - Euro breakout helping this hard hit company?
VIDEO : Bloomberg - U.S. Seeing a 'Virtual Explosion' in Debt Markets
Intellectual TakeOut - Treasury Report: Federal Fiscal Shortfall is $603,000 per Household
my budget 360 - What are the top 10 financial worries of Americans?
Daily Reckoning - Two Ways Forward for the Fed by James Rickards
AUDIO : FSN - G. Edward Griffin & Chris Waltzek on GoldSeek Radio
GOLD NANO-PARTICLES : PNAS - Enhancement of radiation effect on cancer cells by gold-pHLIP
CHARTS : dshort - A Surprising Decline in Consumer Confidence
Mish's Blog - Deconstructing and Debunking Shadowstats
Alhambra Investment Partners - Japan Needs A Bigger Hole?
Hedgeye - Cartoon of the Day: Just Imagine...
ValueWalk - Putin’s Insatiable Appetite for Gold Fueled By These 3 Things
04/27/2015 - Bullion News
CoinWorld - What Does the Quick Sellout of the Silver Homestead Bullion Coin Mean?
CoinNews - Gold, Silver Rally; US Mint Coin Sales Rise
The Speculative Investor - Money is never backed by anything
Armstrong Economics - Gold v Dollar
MineWeb - What happens to gold when the yuan floats free of the dollar?
GoldSeek - SWOT Analysis: What’s Buoying the Demand for Bullion?
Global Financial Intelligence - It worsens war against cash - Google Translation Link
Laissez Faire - New World Currency + Gold’s Slingshot… Coming Soon
AUDIO : FSN - John Rubino – Global War On Cash Breaks Out
The Deviant Investor - Rock-Paper-Silver
BullionStar - El Salvador’s gold reserves, the BIS, and the bullion banks
CNBC - Gold surges: World's 'biggest pawnbroker' makes deal
Wolf Street - The “War on Cash” in 10 Spine-Chilling Quotes
Zero Hedge - Gold Flows East – China, India Import Massive Quantities of Gold from Switzerland
The Telegraph - Russia resumes gold stockpiling as rouble crisis eases
04/26/2015 - Bullion News
TECHNICAL ANALYSIS : CEO.CA - Gold Update: Did Gold Just Complete A Head & Shoulders Top?
TECHNICAL ANALYSIS : Kimble Charting - King Dollar Slipping Below Support
The National Interest - The Fed's Day of Reckoning Nears
cnsnews - 40 Days: Treasury Says Debt Has Been Frozen at $18,112,975,000,000
Of Two Minds - Our Financial Future: Infinite Greed Meets a Funny Thing Called Karma
Business Insider - The Market is Getting Nervous about Liquidity
AUDIO : Financial Sense - Robin Griffiths: Potential Second Half Breakout, But US Markets Moving Into Bubble Territory
GoldSeek - COT Gold, Silver and US Dollar Index Report - April 24, 2015
GoldMoney - Market Report: A week of further consolidation
Secular Investor - Negative Interest Rates: The Financial Black Hole
Zero Hedge - Goldman Gets Cold Feet:"It Is Difficult To Predict How Negative The Market Reaction To Grexit Would Be"
Reuters - El Salvador sells 80 pct of gold reserves to hedge risk -central bank
GoldReporter.de - Venezuela gives 43 tonnes of gold to Citibank - Google Translation Link
Zero Hedge - Is Greece About To "Lose" Its Gold Again?
Hambone's Stuff - Exactly What Did Nixon Say About Dollar Convertibility to Gold?
04/24/2015 - Bullion News
CoinWeek - Gold Sadly Moves to Six-Week Lows
CHARTS : dshort - NYSE Margin Debt Hits an All-Time High
VIDEO : CNBC - Santelli Exchange: War on paper money?
CoinWorld - Stricter anti-money laundering regulations derail gold trading in Belgium - Since April 2012, traders in Belgium have no longer been allowed to pay or be paid in cash for the trading of precious metals for an amount of €5,000 or more
Daily Reckoning - QE = Debt Cancellation
Business Insider - There is a growing disconnect in the stock market
National Inflation Assoc. - US to Face Bond Market Liquidity Crisis
TECHNICAL ANALYSIS : Market Anthropology - Thoughts on Japan, the Yen & Gold
CHARTS : Visual Capitalist - Greece’s Debt and Who’s on the Hook in a Default
INFO~GRAPHIC : Visual Capitalist - Assessing the Risk of a Greek Default
The Bullion Desk - September interest-rate rise looking less likely
SRSrocco Report - 105 Trillion Reasons To Own Silver
The Deviant Investor - Twilight Zone Economies – Part 2
The Globe and Mail - Gold bars, tall tales and hangovers – scenes from the world’s largest mining convention
04/23/2015 - Bullion News
Financial Sense - The Race to Diversify - Too Much Paper, Too Little Gold
GoldReporter.de - Swiss trade data show strong increase in demand for gold - Google Translation Link
TECHNICAL ANALYSIS : Daily FX - USDOLLAR Meager Range Develops after Behavior Change
The Daily Gold - US$ to Correct
VIDEO : CNBC - Santelli Exchange: The big FADE
Alhambra Investment Partners - Turns Out The ‘Rising Dollar’ Is Real
The Mess That Greenspan Made - Another Stunning Long-Term Chart
GOLD NANO-PARTICLES : PhysicsWorld - Tunable plasmon laser could sniff out cancer
GoldMoney - Gold, the SDR and BRICS
Daily Reckoning - We’ll Have QE4 and Probably QE5… or Else, Collapse
Casey Research - Russian Gold Bull Comes Roaring Back
TECHNICAL ANALYSIS : Clive Maund - DOLLAR at CRITICAL JUNCTURE...
The New York Times - Get Paid to Borrow Money (Risks and Limits Apply)
Sovereign Man - Somebody show this chart to Jim Cramer
Zero Hedge - Largest Bank In America Joins War On Cash
04/22/2015 - Bullion News
CoinNews - Gold Ends at April Low; US Bullion Sales Widen
- Silver Eagle Mintage Figures Break above 14 Million
Zero Hedge - The "Smart Money" Has Never Been More Bearish
- Markets have become so extreme, they stick out on the chart like Wilt Chamberlain’s 4th grade class picture.
The Deviant Investor - Twilight Zone Economics
TECHNICAL ANALYSIS : Daily FX - USDOLLAR Former Support is of Interest as Resistance Now
SafeHaven - $GOLD: Year 2007 Again
The Cobden Center - The Over-Valued Dollar
The Speculative Investor - Gold is not a play on “CPI inflation”
AUDIO : McAlvany Weekly Commentary - Forgive Us Our Debts – OR ELSE!
PDF : Bloomberg - Platinum Ignores Fundamentals; When Do Deficits Push Prices?
TECHNICAL ANALYSIS : TheGoldandOilGuy - In Three to Five Years Gold Will Be Priceless
VIDEO : CNBC - 'House of Debt' co-author on the next debt crisis
American Hard Assets - China’s secret gold stockpile may be world’s 2nd biggest
04/21/2015 - Bullion News
Smarter Analyst - Gold Prices: How Not To Piss It Away Next Time
AUDIO : John Batchelor Show - Interview with John Tamny author of "Popular Economics: What the Rolling Stones, Downton Abbey, and LeBron James Can Teach You about Economics" - (Interview is in the first 20min. of podcast)
TECHNICAL ANALYSIS : Bullion Vault - Patience Needed in Precious Metals
TECHNICAL ANALYSIS : The Speculative Investor - Gold and the HUI are coiling
CoinNews - 2015 Kisatchie 5 Oz Silver Bullion Coin Launches
BARRON'S - Gold, Lumber and Their Impact on Stocks
GOLD NANO-PARTICLES : Sun Star - Literatus: Voracious cells and nanoparticles
AUDIO : FSN - Danielle Park – We Will Keep Suffering Until the Markets Are Allowed to Function
Bloomberg - The Fed Still Wants Easy Money
GoldSeek - Currency Wars Back As Russia Buys One Million Ounces of Gold in March
Economic Times - India's Gold imports may rise 89% to 100 tonnes in April: GJF
Secular Investor - Demand for Gold will grow by 25% in China
TF Metals Report - An Overlooked News Item
ETF Trends - China’s Currency Ambitions Could Lift Gold Market, ETFs
Daily Mail - How a $500,000 gold bar recovered by police in Florida was the 'big break' in $5million North Carolina heist investigation
04/20/2015 - Bullion News
Bloomberg - The Mystery of China’s Gold Stash May Soon Be Solved
National Inflation Assoc. - America’s Gold Backs Record Low % of Monetary Base
International Man - The Crowning Glory of Keynesianism
TECHNICAL ANALYSIS : GoldSeek - Has the US dollar topped?
The Bullion Desk - Worst may be behind silver price – BoA Merrill Lynch
MoneyWeb - Central banks to keep buying gold – RBC
GoldSeek - DANGEROUSLY “Dent”ed Logic!
Deviant Investor - The Rise of the Paper Machines
Economic Times - India's Gov't Dilemma...How to Make Citizens Part from Their Gold
Trading Nrg - Gold and Silver Outlook for April 20-24
Hedgeye - Cartoon of the Day: G(LOW)Bal Bond Yields
VIDEO : Market Watch - Jeff Gundlach issues ominous warning for junk-bond market y
Zero Hedge - Stunned Greeks React To Initial Capital Controls And The "Decree To Confiscate Reserves", And They Are Not Happy
VIDEO : Gordon T. Long - De-Dollarization Begin w/John Rubino
CATO Institute - Government Spending: Accounting and Economics
04/19/2015 - Bullion News
TECHNICAL ANALYSIS : CEO.CA - Weekend Commodity Chart Wrap
Alhambra Investment Partners - A Canary In The Coal Mine?
Armstrong Economics - Understanding Jackson’s Bank War
VIDEO : CNBC - Bernanke's hedge fund gig 'wrong on so many levels': Adami
Value Walk - London Bookmakers No Longer Taking Bets On Grexit, Regulators Prepare For Derivatives Fallout
GoldSeek - COT Gold, Silver and US Dollar Index Report - April 17, 2015
TECHNICAL ANALYSIS : Inside Futures - Will Gold Prices Break Out
Nikkei Asia Review - Gold production may peak in 2015 -- report
TECHNICAL ANALYSIS : SOLARCYCLES - All Change At The Solar Max
Zero Hedge - Student Debt Accounts For Nearly Half Of US Government "Assets"
China Daily - China cuts US Treasuries holdings to diversify forex reserves
Project Syndicate - The Problem With Secular Stagnation
Bloomberg - Iran, Secret Gold and the Mystery Trade Boosting Turkish Exports
04/18/2015 - Bullion News
Daily Reckoning - Gold is (Once Again) Money
TECHNICAL ANALYSIS : SafeHaven - Gold's Next Move
CHARTS : Zero Hedge - A World Of Bubbles
The Guardian - Greece pushed a step closer to eurozone exit after IMF snub
The Speculative Investor - If you owe the bank $100M and you can’t pay, the bank has a problem
AUDIO : Financial Sense - Jim Puplava’s Big Picture: Financial Repression – The Greatest Wealth Transfer in History
Peak Prosperity - Has The Fed Already Lost?
CHARTS : McClellan Oscillator - US Taxes Returning to Economy-Killing Level
VIDEO : Market Watch - George Carlin and the new retirement minimalism
Tenth Amendment Center - Texas Bill to Establish Bullion Depository, Help Facilitate Transactions in Gold and Silver, Passes Committee 7-0
04/17/2015 - Bullion News
CoinWorld - Becoming a ‘bullionaire': World Silver Bullion Abounds in Affordable Sizes
Secular Invesor - What Is Really Driving Gold?
International Man - Doug Casey explains how banking is supposed to work vs. how it actually works today.
CHART : Zero Hedge - Well That's Never Happened Before
TECHNICAL ANALYSIS : Clive Maund - US STOCKMARKETS update - GETTING SCARIER BY THE DAY...
CHARTS : dshort - A Long-Term Look at Inflation
VIDEO : CNBC - Watch out for this topic at IMF meeting - Interview with Jim Rickards
GOLD NANO-PARTICLES : CancerTherapyAdvisor - Internalization: Acute apoptosis of breast cancer cells using herceptin-immobilized gold nanoparticles
REWIND : VIDEO : Clark & Dawes - Greek Debt - 2011 & 2015 - Nothing has Changed
CHARTS : National Inflation Assoc. - Russia vs. Greece
TECHNICAL ANALYSIS : TheGoldandOilGuy - Gold Price: Year 2000 All Over Again – How Will You Play It This Time?
SRSrocco Report - THE U.S. GOLD MARKET: Completely Insane
Reuters - US must return rare double eagle gold coins to family
News Moving Markets - Silver coins worth $50 million recovered from WWII wreck
The Guardian - Royal Mint to welcome visitors for first time with £7.7m museum
Affiliate Ad
04/16/2015 - Bullion News
Value Walk - Buying Gold & Silver: You Have No Right To Be Scared - The Buyers of 15 Years Ago Saw the Future
TECHNICAL ANALYSIS : CFD Trading - US Dollar: Risk of a Major Correction At Highest Level Since Rally Began Last July
Reuters - Platinum, palladium forecasts cut on oversupply, soft demand
AUDIO : The Goddard Report - Mike 'Mish' Shedlock - We’re In One of the Riskiest Bubbles of All Time
Laissez Faire - Gold Standard Redux: All That Glitters…
Zero Hedge - Central Banks Made The Whole World “Buy Time”... There Are Signs We’re Beginning To Sell It
Daily Reckoning - Jim Rickards - A Brief History of Currency Wars
The Sovereign Investor - How to Escape America’s Economic Bubble
VIDEO : CNBC - This is why the Fed might not raise rates in 2015 : Rick Santelli
CHART : Visual Capitalist - Commodity Scoreboard: Uranium and Silver Led the Way in Q1
TECHNICAL ANALYSIS : Acting Man - Gold Sector – Tentative Signs of Life
The Corner - Japan beats China as main US debt holder
Gold-Eagle - Chinese Gold Demand To Remain Strong, Middle Class Still Growing – HSBC
Institutional Investor - Rush to Join AIIB Reflects China's Growing Financial Clout
04/15/2015 - Bullion News
Economic Policy Journal - Now IMF Warns of 'Uncharted Territory' "Super Tantrum" in Bond Markets - (Note: After reading today's Top Article, Take a look at Yesterday's top article on the guide, then you will know what to expect for the future movement in the dollar and gold)
CoinNews - Gold Prices Bounce Over $1,200; Rises 0.7%
Market Watch - Here’s where your tax dollars go
TECHNICAL ANALYSIS : Kimble Charting - King Dollar investors establish most “Crowded Trade” in history?
VIDEO : CNBC - Ron Paul: Watch out. Dollar's in a 'huge bubble'
Global Financial Intelligence - Gold, the yuan and multicurrency reserve system - Google Translation Link
GOLD NANO-PARTICLES : ExtremeTech - Real-time visualization of nanoparticles interacting with tumor cells
AUDIO : McAlvany Weekly Commentary - A Meeting of the Billionaire Minds
The Boston Globe - State’s exports enjoying a gold rush - Massachusetts shipped nearly $2 billion of the precious metal to far-flung markets last year
The Bullion Desk - Asia set to muscle out Europe in gold trading – ICE’s Ho
PDF : The Gold Standard Institute - Monthly Journal Issue #52
AUDIO : Physical Gold Fund - Interview with Jim Rickards
Laissez Faire - Currency Warts and All
Bloomberg View - Greece Is Running Out of Money, and Time
VIDEO : Visual Capitalist - The European Debt Crisis Visualized
04/14/2015 - Bullion News
GoldReporter.de - Bank of America: "Gold could have seen the worst" - "We believe the upcoming increase in the federal funds rate is the only major hurdle for sustainable gold price rise" (Google Translation Link)
Daily Reckoning - The Strong Dollar Could Turn on a Dime
PDF : 321 gold - Gold and silver will be increasingly bought as a hedge against the US dollar and the illiquidity in the bond markets. Part 1
GOLD NANO-PARTICLES : LabMedica - Gold Nanoparticle-Based Test Better for Prostate Cancer Diagnosis Than PSA
Daily Mail - Shrinkflation! How sneaky firms are making your favourite products smaller, but NOT shrinking the price
Thoughtful Cynic - Our Current Economic Woes – Part 2: How We got Here (and Why Raising Taxes Won’t Work)
Business Insider - Bubble fears just hit their highest level on record
TECHNICAL ANALYSIS : The Bullion Desk - Palladium – Complex bottoming-out process
Daily Reckoning - Why the U.S. is Letting China Accumulate Gold
Casey Research - How will India Melt Down the Hindu God's Gold
The Tribune - Taking stock of India's gold monetisation schemes
VIDEO : Future Money Trends - How to Get Rich Today! Interview with Billionaire Jim Rogers
Cobden Centre - Ben Bernanke Now Blogs
04/13/2015 - Bullion News
Doijer & Kalff - US Companies to Borrow Cheaply in Euros
- Google Translation Link
Economic Policy Journal - Beware of IRA and 401Ks (Especially Checkbook IRAs)
CoinNews - Gold Slips; 2015 Silver Eagles Top 13M
MINING - Annual gold trade reaches $22 TRILLION
Mises Institute - Ben Bernanke’s Latest Defense of the Fed’s Failures
The Speculative Investor - The official CPI versus the Shadowstats.com CPI
GOLD NANO-PARTICLES : Medical Express - Gold by special delivery intensifies cancer-killing radiation
The Deviant Investor - Stacking Silver = Simple Solution
TECHNICAL ANALYSIS : Clive Maund - Gold Market Update
TECHNICAL ANALYSIS : Clive Maund - Silver Market Update
Sunshine Profits - Gold News Monitor: GFMS Gold Survey 2015
GoldBroker - India’s Official Gold Imports in 2014-15 Stood at 900 Tonnes
The Bullion Desk - China gold demand to exceed 2,000t per year in 2-3 years – MKS
Coin Update - Royal Mint Fractional Gold Coins Offered in New Packaging
Daily Mail - Caught on camera with a wheelie bin full of jewels: Dramatic first pictures of heist in progress show relaxed Hatton Garden gang removing £60million worth of gems
Free Shipping on Orders $199+ | 5.0 star Customer Reviews
04/12/2015 - Bullion News
TECHNICAL ANALYSIS : CEO.CA - Why Friday’s Session Was Highly Significant for Gold
VIDEO : Gordon T. Long - Interview with Rick Rule
VIDEO : CNBC - Druckenmiller: This could end 'very badly'
BullionStar - Shanghai International Gold Exchange Comes To Life
AUDIO : The Daily Gold - Interview with David Morgan - TheDailyGold Weekend Podcast
Sputnik - Georgia, Denmark, Brazil, Netherlands, Finland Join China's AIIB Bank
Wealth Daily - Is America Losing?
FOFOA - Metamorphosis Revisited
Deccan Chronicle - Kerala says no to transfer of temple gold to banks
The Courier (UK) - EXCLUSIVE: Discovery of huge cache of Nazi gold provides incredible twist in Secret Bunker story
04/10/2015 - Bullion News
Tocqueville - Tocqueville Gold Strategy Investor Letter First Quarter 2015
The Speculative Investor - Production must precede consumption. The reason is not rocket science.
Bullion Vault - Gold Mining Growth 'Ends in 2015', Industry 'Precarious'
Of Two Minds - Today's Money Regimes Are Doomed To Failure
The Hindu - Cash-strapped Modi government eyes temple gold
VIDEO : Get Real - Jan Skoyles: Platinum and Palladium
Gold-Eagle - History Is Fact (Part 1)
VIDEO : CNN - How a Heist is Masterminded
Smarter Analyst - China Gold Reserves Reach Alarming Level
The Fiscal Times - 10 Scams That Prey on Your Investments
Market Watch - Apple GE lead the share buyback table
FOFOA - The Golden Phoenix
04/09/2015 - Bullion News
TECHNICAL ANALYSIS : Forbes - Where Are Gold And Silver Heading Next?
Market Watch - Gold bugs might have their day in 2016
MineWeb - Top 20 gold consumers: China still No. 1 – GFMS
Bullion Vault - Hatton Garden 'Safe' Deposit? Unmanned, Unchecked, Uninsured
The Globe and Mail - Mexican gold mines beset by robberies, kidnappings
TECHNICAL ANALYSIS : CFD Trading - Is a Meltdown in Gold and Silver Around the Bend?
GOLD NANO-PARTICLES : Today's Medical Developments - Supersensitive nanodevice can detect early cancers
TECHNICAL ANALYSIS : GoldSeek - The US Dollar Rally Will Crush Stocks Just As It Did in 2008
Perth Mint Blog - Unbridled love of gold in the East
The China Money Report - Why Gold Ownership Continues to Grow in China
Commodity Online - India Platinum market to grow 23% in 2015
AUDIO : McAlvany Weekly Commentary - Dr. Pippa Malmgren: Look for the Signals
BullionStar - Zooming In On The Chinese Gold Lease Market
04/08/2015 - Bullion News
CHART : Things That Make You Go Hmmm - 1-2-3
CHARTS : Zero Hedge - The "Markets" React To FOMC-Minutes-Implied Fed Confusion
TECHNICAL ANALYSIS : The Deviant Investor - S&P Cycles Suggest Caution
CoinNews - Gold Slips 0.6%; US Mint Gold Sales Rise
TECHNICAL ANALYSIS : TheGoldandOilGuy - Logical 4 Month Market Forecast – Gold, Oil, Stocks & Bonds
VIDEO : CNBC - Fed members torn over rate hike timing, with some seeing 2016, minutes show
Market Watch - The unseen downside of strength in the dollar
GOLD NANO-PARTICLES : Morning Ledger - Nanoparticles Combat Children’s Cancer
Numismatic News - Special rules for gold coin IRA
VIDEO : Silver-Investor - David Morgan: Silver Is Historically Undervalued
Alhambra Investment Partners - Gallup’s View Inside the Bunker
Alhambra Investment Partners - Consumers Further in the Bunker
Casey Research - Mexican Gold Heist Changes Security Landscape
BullionStar - Pro-Gold Governments and Central Banks
CoinWeek - Perth Mint Releases New Funnel-Web Spider Bullion Coins
Free Shipping on Orders $199+ | 5.0 star Customer Reviews
04/07/2015 - Bullion News
CEO.CA - We Are in A Secular Stagnation – Ray Dalio
CHART : HEDGEYE - CHART OF THE DAY | Initial Claims: As Good As It Gets?
VIDEO : CNBC - Dire costs of easy Fed now and later: Jim Grant
TECHNICAL ANALYSIS : Kitco - Are Gold Bulls Carving Out A Major Bottom Pattern?
TECHNICAL ANALYSIS : CFD Trading - Gold (XAUUSD) & Silver (XAGUSD) Technical Update
TECHNICAL ANALYSIS : The Deviant Investor - Silver Projection From Crude Oil and T-Bonds
GOLD NANO-PARTICLES : Fast Co.Exist - These Printable Tests For HIV And E.Coli Will Bring Diagnosis Anywhere In The World
Thoughtful Cynic - Of Cowards, Politicians and Central Bankers; Our Current Economic Woes
cnsnews - 21 Days: Treasury Says Debt Has Been Frozen at $18,112,975,000,000
MineWeb - Gold supply boom ending as price slump means less mine spending
SRSrocco Report - U.S. GOLD MARKET 2012-2014: Suffers Massive Deficits
VIDEO : GoldBroker - David Morgan: Silver and Its Relation to Gold
TECHNICAL ANALYSIS : Market Anthropology - Scarcity & Oversupply: The Intriguing Market Dynamics Between EUR:USD, Bunds & Oil
BullionStar - Spelling Out The Big Reset
ars technica - Bitcoin Foundation is “effectively bankrupt,” board member says
04/06/2015 - Bullion News
The Sovereign Investor - How to Stay Ahead of the Investment Herd
TECHNICAL ANALYSIS : King One Eye - US Dollar Falls Below Uptrend. What Happens Next?
Numismatic News - Gold supplies won’t run out
VIDEO : Fox Business - Julian Robertson on the U.S. economy, bond bubbles
World Gold Council - Gold recycling: new report examines the evolving industry that contributes a third of global gold supply
TECHNICAL ANALYSIS : The Deviant Investor - 3 Sigma Extremes In the Bond Market
VIDEO : CNBC - Gold gets support; Here's the play
GOLD NANO-PARTICLES : Nanotechnology Now - MIPT researchers put safety of magic anti-cancer bullet to test
Market Watch - Should you follow Mohamed El-Erian and move your investments to cash?
Forbes - Disaster Is Inevitable When The Two Decade-Old Stock Bubble Bursts
Zero Hedge - We've Never Seen This Before In The Gold Market
GATA - LBMA admits gold market can't be transparent with central banks in it
Sovereign Man - It just happened: “The moment the United States lost its role . . .”
JCK - Watches & Jewelry Tops Counterfeit List
PowerLine - The Economy Continues to Sputter: It’s a Mystery!
Economic Policy Journal - The Changing Job Structure in America
04/05/2015 - Bullion News
MoneyBeat (WSJ) - Broken Bond Market Complicates Fed’s Plan to Raise Rates
TECHNICAL ANALYSIS : SafeHaven - Precious Metals Will Likely Rally (while the stock market whipsaws)!
CHARTS : Cobden Centre - How liquidity drives the US stock market
Solidus Center - Open Letter to Brookings Blogger Ben Bernanke
BullionStar - Thoughts On The Price Of Gold
TECHNICAL ANALYSIS : SOLARCYCLES - Big Picture USA
Silver Coins Today - Win Silver Coin in Pobjoy Mint’s Easter Egg Hunt
TECHNICAL ANALYSIS : CEO.CA - This is About to Happen for the First Time in 29 Months...
VIDEO : Wealth Track - Interview with Liaquat Ahamed, the Pulitzer Prize winning author of Lords of Finance - Discusses the differences and similarities between central bank policies today and those leading up to the Great Depression.
The Deviant Investor - The Capital Destruction of the American People
TheTownTalk - Kisatchie National Forest adorns Louisiana ATBB coin
Reuters - Greece says ready to make IMF payment on April 9
Sputnik - BRICS May Create Credit Rating Agency
VIDEO : Zero Hedge - The Only TV News Report On The Economy You'll Ever Need
04/03/2015 - Bullion News
The Sovereign Investor - The Best Way to Avoid the Dollar Crisis
TECHNICAL ANALYSIS : FXStreet - Gold Analysis – could break inverted head and shoulder and rise to USD 1250/Oz
Yahoo - End of robust hiring streak raises doubts about job market
CHARTS : dshort - March Had a Significant Decline in Jobs Growth
VIDEO : Fox Business - James Grant: Don’t expect rate hike in 2015
24hGold - World Gold Council considers launch of new London exchange
BullionStar - Gold, Governments and Central Banks
GOLD NANO-PARTICLES : AZOnano - Small Gold Nanoparticles Conjugated with miR-182 Sequences Cross Blood-Brain/Blood-Tumor Barrier
GOLD NANO-PARTICLES : Science Blog - Studies find $1 test using gold nanoparticles outperforms PSA screen for prostate cancer
Investment Week - Bill Gross: Why the 'new neutral' could prove hostile to investors
National Inflation Assoc. - NYSE Margin Debt Grows by $20.1B and About to Hit New Record High!
MineWeb - Gold’s Top 20 – Mines, miners and countries
CoinWorld - Looming repeal of sales tax exemption driving Pennsylvania dealer out of state
04/02/2015 - Bullion News
The Street - The 5 Biggest Myths About Investing in Gold and Silver
Daily Reckoning - Beware the Money Illusion Coming to Destroy Your Wealth
CoinNews - Gold Edges Up on Week; US Mint Bullion Sales Mixed
Casey Research - Doug Casey : Signs of a Resource Sector Bottom
Alhambra Investment Partners - No Data Supports the ‘Strong Dollar’
TECHNICAL ANALYSIS : The Deviant Investor - Extremes: Expect Consequences-Part 2
GoldMoney - Valuing gold - USD FMQ Update
CHARTS : dshort - The Market Remains High in Overvaluation Territory
Scrap Register - Main sea freight index at Baltic Exchange drops to below 600 points ahead of Easter
VIDEO : CNBC - Rick Santelli gives the "spread" on today's trade deficit drop
CHARTS : Of Two Minds - The U.S. Economy Slows to Stall Speed
TECHNICAL ANALYSIS : TheGoldandOilGuy - Do Equities Just Correct or Collapse in 2015?
CoinWeek - Virginia Passes Bullion Sales Tax Exemption Bill
Economic Policy Journal - Greece Tells Creditors It Will Run Out of Cash on April 9
Zentrader - Manage Your Personal Finance with Debt Relief
Investopedia - What Are IMF Special Drawing Rights?
04/01/2015 - Bullion News
CoinWorld - 2015 Mexican silver and gold Libertads coming soon
Perth Mint Blog - Monthly Sales – March 2015
CoinNews - Gold, Silver Mixed in March and Quarter; US Mint Coins Solid
Business Insider - Something scary happened in the stock market, and what one analyst said about it was even scarier
AUDIO : McAlvany Weekly Commentary - An Epic Reversal of Fortunes is Nigh
The Deviant Investor - Extremes: Expect Consequences-Part 1
National Inflation Assoc. - China’s Secret Gold Buying Exposed
Casey Research - Will Gold Win Out Against the US Dollar?
CoinNews - Sales of 2015 Homestead 5 Oz Silver Bullion Coins Hit Max
VIDEO : Next Big Trade - The Great Irony of the Gold Bears
MineWeb - End of bear cycle for gold in 2015 – Metals Focus
sify - India hikes import tariff on gold, silver
04/01: Zero Hedge - Companies Go All-In Before Rate Hike, Issue Record Debt In Q1
INFO~GRAPHIC : Visual Capitalist - The Greatest Inventions of All Time
Other pages, on this Guide, that you
may like...
|
|
|
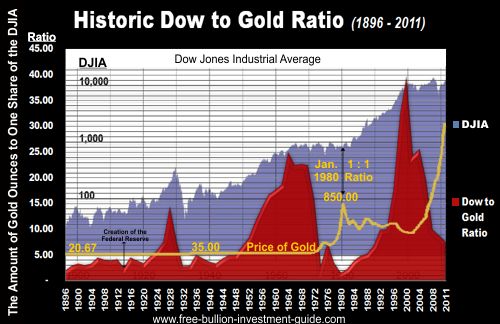


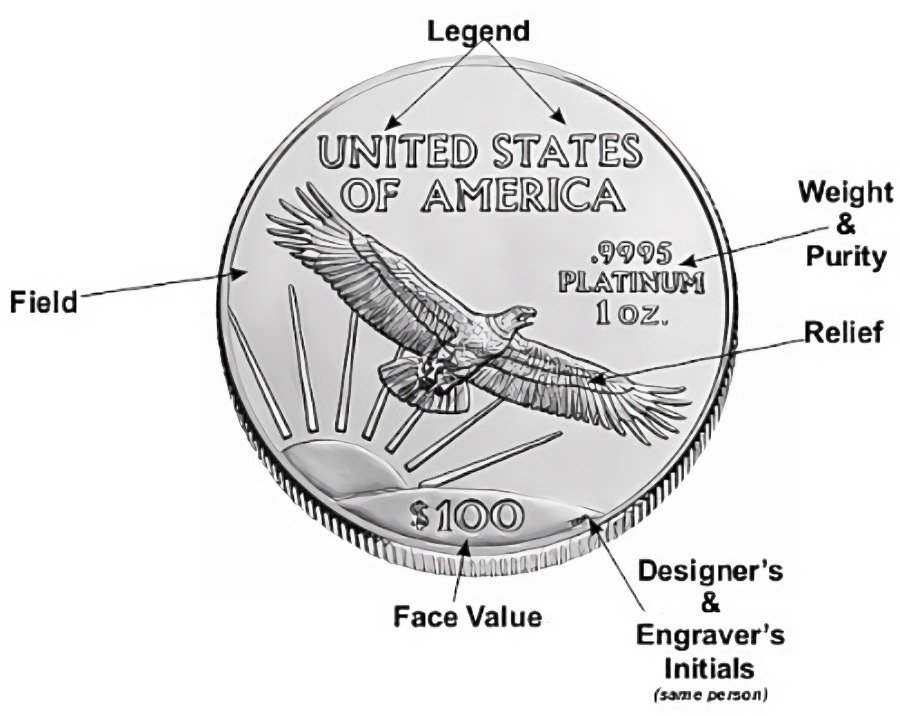


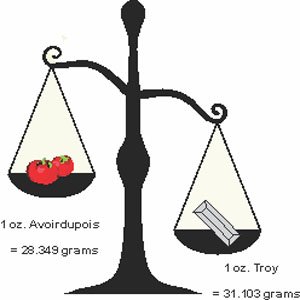

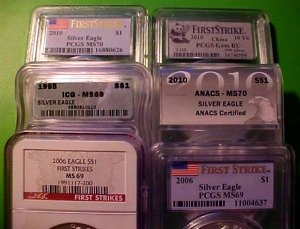


Free Shipping on Orders $199+ | 5.0 star Customer Reviews
For Bullion Market News...
Notice:
The charts, commentary, and information on the Free-Bullion-Investment-Guide.com are in no way an endorsement of how you should invest or divest.
|
Support this Guide & Paypal Thank You for Your Support |
|
|
 | |||||

Recent Articles
-
Newsletter of the Free Bullion Investment Guide - February 2026
Feb 07, 26 04:05 PM
 The February 2026 newsletter of the Free Bullion Investment Guide provides the latest updates, fundamental and technical gold and silver market analysis, the best articles from last month, and a list…
 -
Newsletter of the Free Bullion Investment Guide - December 2025
Dec 07, 25 02:24 PM
 The December 2025 newsletter of the Free Bullion Investment Guide provides the latest updates, fundamental and technical gold and silver market analysis, the best articles from last month, and a list…
 -
Newsletter of the Free Bullion Investment Guide - November 2025
Nov 08, 25 01:52 PM
 The November 2025 newsletter of the Free Bullion Investment Guide provides the latest updates, fundamental and technical gold and silver market analysis, the best articles from last month, and a list…
 -
Premium Bullion - 1 oz Silver Majestic Polar Bear Coin
May 18, 25 04:17 PM
 The Premium Bullion - 1oz Silver Majestic Polar Bear coins are specially made for collectors and investors alike; they are made of 99.99% pure silver and have a limited mintage; it is in an assay card…
 -
Latest Update (3/14/25) from the Free Bullion Investment Guide
Mar 14, 25 11:23 PM
Free Bullion Investment Guide's Latest Updates: Mexican Gold and Silver Libertad - 2024 Mintage Figures & more...

18W LED Security Light (Dusk to Dawn & Motion Sensor) - $32.99
from:
 LED Lighting


This website is best viewed on a desktop computer.
Keep this Guide Online
& Paypal
Thank You for
Your Support
with Feedly
Search the Guide
| search engine by freefind | advanced |
Premium Canadian Bullion

Give a lasting gift of the iconic Silver Maple Leaf bullion coin [More]
Free Shipping on Orders over $100 (CDN/USA)
or
From the U.K. Royal Mint


Daily
Newsletter
Updated Mintages for
American Gold Buffalo
American Gold Eagle
American Silver Eagle

2024 & 2025
Jerusalem of Gold Bullion
Coin photos
(bottom of page)
 Obverse side")
 Obverse side")
Mintages
for
2024
Gold & Silver Mexican Libertad
|
Gold Libertads |


Chinese Gold Coin Group Co.
& Chinese Bullion


Help Us Expand our Audience by forwarding our link
www.free-bullion-investment-guide.com.
Thank You!
Last Month's

In No Particular Order
January 2026
All Articles were Originally Posted on the Homepage


Click Ad to Request a Free Appraisal Kit
ExpressGoldCash
Customer Reviews 4.9 stars


Give a lasting gift of the iconic Silver Maple Leaf bullion coin [More]
Free Shipping on Orders over $100 (CDN/USA)
