Homepage / Archived News or Quarterly News / 1st Quarter 2015

Free Shipping on Orders $199+
1st Quarter - 2015
Charts, Bullion News & Commentary
Date Posted: 4/29/2015 @ 4:32AM
The charts analysis and bullion news links on this page are devoted to the precious metals markets during the 1st Quarter of 2015.
When investing in any market, a good way to judge price movement in the future is to learn from the past.
Frederick Douglass
(1818 - 1895) was a former slave who became a famous human rights leader, writer, and statesman during the abolition movement, who once stated, "Knowledge makes a man unfit to be a slave."
The combination of the charts and news (below) helps you gain "knowledge" of these markets, so you won't become a "slave" to them.
The charts below are provided courtesy of
US Dollar
Charts
1st qtr. of 2015
Bullion News
US Dollar Quarterly - Price Chart (January 1st, 2015 - March 31st, 2015)

The US Dollar Summary
During the 1st quarter of 2015, the US dollar continued its upward trend. However, like in the last quarter, the dollar has started to consolidate after each move upwards, which is healthy for any market. But, after hitting $100.71, the US dollar looks like it might be topping out.
In addition, the US Dollar's run-up to $100.71 occurred because of the Market's anticipation of the Federal Open Market Committee (FOMC) statement release.
(continued)
US Dollar 1 year - Price Chart (January 1st, 2014 - March 31st, 2015)

Bullion News
The Financial Media like to extract certain 'words or phrases' out of the Fed's statements to try to predict which way the Fed may or may not move in policy.
The words or phrases have included: "Tapering," "Considerable Time," and most recently, "Patient."

It's all Nonsense the financial media use these words to rile the markets, and sad to say, "it usually works." The Fed changed their wording this time, but they basically said they're not going to raise rates.
Instead, the Fed said it was going to watch market data for future movements in the Federal Funds Rate. After the Fed balked at raising rates, the US Dollar started to lose some of its strength.
The U.S. Dollar and Gold often move in opposite directions; you will be able to see this relationship in price movement in the Gold Analysis Section below.
US Dollar 3 year - Price Chart (January 1st, 2012 - March 31st, 2015)

Greece & How it Affects the US Dollar?
One possible area for future US Dollar strength (besides an Interest
Rate hike) has to deal with what happens to Greece's place in the
European Union and what happens to its debt. Nobody really knows what
will happen if they exit the Euro; some in the market say the Euro will
fall, which would send the dollar higher. However, others suggest that
it may not be bad for the Euro if Greece exits the currency union.
One thing does seem
certain is that Greece's current government does not favor austerity. The two infographics below have recently come out; they may help you to
understand who Greece owes its debt to and what the possible
consequences are if Greece defaults or exits the Euro.
Greece’s Debt and Who’s on the Hook in a Default
Assessing the Potential Risk of a Greek Default
US Dollar 5 year - Price Chart (April 1st, 2011 - March 31st, 2015)

Bullion News

The US Dollar, the Fed and
Interest Rates Hikes
If you've been paying attention to chart analysis concerning the US Dollar, then you've probably seen the chart below.
It shows the U.S. Dollar chart breaking a thirty-year trend line in its recent rise in price, which is a very good sign for the U.S. Dollar and a very bad sign for Gold.
US Dollar breaking Trend-line

44 year US Dollar Chart courtesy of: Trading Economics
Interest Rates Hikes
The Past & Present
The chart below reveals a pattern of what has happened nearly every time the Federal Reserve has raised interest rates too high: a Recession.

The Fed's backed into a corner
If the Federal Reserve raises rates now, it may do the same as it has done in the past: cause a recession. Their hesitation makes them look scared.

Gold Price Charts
1st qtr. of 2015
Gold Price Summary
During the 1st Quarter of 2015, the price of gold moved up in the first three weeks to slightly above $1300 a troy ounce, then the price dropped over the next two months to $1140 a troy ounce.
The reasons for gold's price movement during this quarter were mostly dictated by international events and the policies of the world's central banks, the Fed and ECB in particular.
(continued...)
Gold Quarterly - Price Chart (January 1st, 2015 - March 31st, 2015)

Gold rose for the first several weeks of the quarter due to the fighting between Russia and Ukraine. Also, gold prices have historically moved up in January.
On January 22nd, the ECB (European Central Bank) announced that it was going to start its own version of QE, or Quantitative Easing. See the article here.
The Euro and gold often move in the same direction, and both often (but not always) move in the opposite direction from the US Dollar. Furthermore, even though the European Central Bank's QE program wouldn't start until March 9th, once the ECB announced the QE program, it started to bring down gold and the Euro.
Gold also sold off due to the market's anticipation of an Interest Rate hike by the FOMC (Federal Open Market Committee) at its March 2015 meeting, which will be held on the 17th and 18th of the month.
Ultimately, the Fed did not raise interest rates, even though many had previously predicted they would. In addition, the Federal Reserve Chair, Janet Yellen, repeatedly said, during her press conference, that future rate hikes would be data-driven.
continued....
Gold 1year - Price Chart (January 1st, 2014 - March 31st, 2015)

Bullion News
Gold's MACD showed by its movement (chart above) that there were signs late in the 1st quarter of 2015 that the price of gold was going to be moving upward early in the 2nd Quarter of 2015.
However, gold's RSI (upper indicator) shows that strength in the price of gold may correct or consolidate early in the next quarter.
The $1180 price level is an important level for the price of gold; it acts more as a support level because almost every time gold has broken it, the price of gold has moved back above it within a few days or a week at most.
Only when or if gold moves below $1180 and stays below it will it become a very strong Resistance Level for gold.
Gold 3year - Price Chart (January 1st, 2012 - March 31st, 2015)

Bullion News
Gold 5 year - Price Chart (April 1st, 2011 - March 31st, 2015)


ExpressGoldCash - 4.9 star - Customer Reviews
Silver Price Charts
1st qtr. of 2015
Silver Quarterly - Price Chart (January 1st, 2015 - March 31st, 2015)

Bullion News
Silver Price Summary
For the 1st Quarter of 2015, silver's price chart looks almost identical in movement to that of gold's chart. Silver, like gold, is a safe-haven currency, but silver acts more as an industrial metal than a safe-haven currency like gold.
(continued...)
Silver 1 year - Price Chart (January 1st, 2014 - March 31st, 2015)

Bullion News
During the quarter, silver moved up in price, creating a new resistance level of $18.50, and then it broke below the resistance level of $18.00.
(continued...)
Silver 3 year - Price Chart (January 1st, 2012 - March 31st, 2015)

Bullion News
On the 5-year chart below, two trendlines have been drawn; a small one is seen on silver's RSI, and there is a 4-year trendline on silver's MACD.
These trendlines may be an indication that silver is going to move higher in the future; however, time will tell.
Silver 5 year - Price Chart (April 1st, 2011 - March 31st, 2015)

Bullion News
Free Shipping on Orders $199+ | 5.0 star Customer Reviews
Platinum Price Charts
1st qtr. of 2015
Platinum Price Summary
During the 1st Quarter of 2015, the price of Platinum moved in the same pattern as Gold and Silver. It was up early in the quarter, then fell in price for the last two-thirds of the quarter.
continued...
Platinum Quarterly - Price Chart (January 1st, 2015 - March 31st, 2015)

Bullion News
Although Silver and Platinum often trade in the same ways as gold, like a safe haven, their industrial demand caused the two metals to be more volatile in their movement.
Early in the quarter, the price of Platinum tried to test its new resistance level of $1295 a troy ounce, but it was unable.
Platinum 1 year - Price Chart (January 1st, 2014 - March 31st, 2015)

Bullion News
Platinum 3 year - Price Chart (January 1st, 2012 - March 31st, 2015)

Bullion News
Platinum 5 year - Price Chart (April 1st, 2011 - March 31st, 2015)

Free Shipping on Orders $199+
Palladium Price Charts
1st qtr. of 2015
Palladium Quarterly - Price Chart (January 1st, 2015 - March 31st, 2015)

Bullion News
Palladium Price Summary
During most of this quarter, the movement in the price of palladium was very choppy. Although palladium is a precious metal, it primarily trades more as an industrial metal than a safe-haven precious metal like gold. This is because most of its supply is used for automobile catalytic converters.
....continued
Palladium 1 year - Price Chart (January 1st, 2014 - March 31st, 2015)

Bullion News
In early March, Russia, the world's largest supplier of the precious metal, released a Palladium Export Report. In the report, Russia showed that they exported 21,600 troy ounces of palladium in January, which was more than three times the average monthly rate from the previous year.
See the article here.
Due to this supply report from Russia, the price of Palladium moved down throughout the end of the quarter. However, the RSI (upper indicator) looked to be turning from its oversold position in the quarterly chart - above.
The MACD (lower indicator), on the other hand, continued sloping downward, but it looks to be getting over-extended to the negative.
In conclusion, in the next quarter, palladium may be higher, but only time and demand will tell where the price of palladium will go in the future.
Palladium 3 year - Price Chart (January 1st, 2012 - March 31st, 2015)

Palladium 5 year - Price Chart (April 1st, 2011 - March 31st, 2015)

The charts above are provided courtesy of
1st Quarter - 2015
Bullion News & Commentary
The Quarterly News starts with the end of the quarter articles, first.
Please note that not all of the links below work; the links are kept because the headlines still provide insight into how the markets were moving at the time.
03/31/2015 - Bullion News
ForexMagnates - The Portfolio Benefits of Investing in Gold
GoldReporter.de - Gold industry is afraid of rising oil prices - Google Translation Link
BloombergeView - U.S. Opposition to Asian Bank Is Self-Destructive
Bloomberg - Currency Market Adopts Voluntary Code to Clean Tainted Image
Zero Hedge - Gold In Fed Vault Drops Under 6,000 Tons For The First Time, After 10th Consecutive Month Of Redemptions
MarketWatch - In 20 years, the world may run out of minable gold
cnsnews - Americans Must Work Jan. 1 Through April 24 Just to Pay Taxes
Sovereign Man - Young people: here are five (OK, six) alternatives to heavily indebting yourself
msn money - The Poorest County in Each State
The Deviant Investor - Crazy Is My Middle Name
03/30/2015 - Bullion News
Institutional Investor - The Fed Seems Afraid of its Own Shadow
TECHNICAL ANALYSIS : Kitco - Gold Retreats From Resistance, Stuck In Large Range
VIDEO : CNBC - Santelli Exchange: A world awash in reserves
CMI Gold & Silver - The Stock Market is Managing the Fed
Mises Institute - Why Is the Fed Punishing My Parents?
CHARTS : dshort - NYSE Margin Debt Surged in February
The Bullion Desk - Gold dips after Fed’s Yellen hints at rate rise
Sunshine Profits - Gold News Monitor: Rising Inventory to Sales Ratio
MineWeb - China gold flows to hit Q1 record
BullionStar - This Is What The AIIB Is About
AUDIO : FSN - John Rubino – Why Are We Feeling Poorer? Is It The Reverse Wealth Effect?
TECHNICAL ANALYSIS : CFD Trading - Gold, Silver & Copper at Critical Junctures
INFO~GRAPHIC : Visual Capitalist - How America’s Middle Class Has Shrunk Since 2000
Sovereign Man - Every young person should see the Fed’s startling numbers on student debt
CoinUpdate - United States Mint 2014 Financial Results
03/29/2015 - Bullion News
MineWeb - WGC Cautions Against Common Gold Wisdoms
VIDEO : endlessmountain - Technical Analysis : Silver Market Update
CHARTS : dshort - ECRI Recession Watch: Weekly Update
TECHNICAL ANALYSIS : SOLARCYCLES - Post Equinox
AUDIO : Financial Sense - Cash Is Trash – More Bad News for Savers
POLL : Zero Hedge - What Bond Investors Are Most Concerned About
VIDEO : Fox Business - James Grant of Grant’s Interest Rate Observer discusses risk in the markets and the Fed
AUDIO : Peak Prosperity - Steve Keen: The Deliberate Blindness Of Our Central Planners
The Sovereign Investor - The Next Currency Set to Fail
The Alternative Investing Daily - Serious Investors know that Gold is not just a Fair-Weather Friend
Mises Institute - Brazil: Victim of Vulgar Keynesianism
MoneyWeek - Compared to gold, UK property is starting to look expensive
New York Post - Stock market rigging is no longer a ‘conspiracy theory’
MineWeb - Red rag to gold bulls – JPMorgan added to LBMA Gold Price banks
CoinWeek - Coins, Other Contents of Boston Time Capsule Revealed
INFO~GRAPHIC : Visual Capitalist - Everything You Need to Know About Copper Porphyries
03/28/2015 - Bullion News
The Telegraph - Fund Manager Explains Why He Invests in Gold: "I am not willing to risk my own and my clients’ capital when stock markets across the globe have been artificially inflated by QE."
Economic Policy Journal - SOLVED: The Problem of 'The Oversupply of Economic Wisdom'
VIDEO : Next Big Trade - Gold and Gold Stocks Update
Alhambra Investment Partners - Cash Flow Seems To Explain Why 5% GDP Was A Myth (Among Other Discrepancies)
The Deviant Investor - Gold & Silver Stocks Will Rise Again!
Journal Sentinel - The case for owning gold-related assets
Zero Hedge - Peak Gold? Goldman Calculates There Is Only 20 Years Of Gold Supply Left
Mish's Blog - Misunderstanding "Peak Gold"; Gold About to Run Out?
CHARTS : dshort - Median Household Income Up Slightly in February
ABCnews - Asian Infrastructure Investment Bank: Australia to sign Memorandum of Understanding to join China development fund
Xinhua.net - Chinese bank, Canadian group to jointly explore offshore RMB market
GOLD NANO-PARTICLES : engadget - Laser-activated nanoparticles are coming to clear your acne
Affiliate Ad
03/27/2015 - Bullion News
How the Fed is 'Screwed,' and What Happens Next
VIDEO : CNBC - How the Fed is 'screwed,' and what happens next (Link to Video Above)
VIDEO(s) : Zero Hedge - Santelli Stunned As Janet Yellen Admits "Cash Is Not A Store Of Value"
Bullion Star - When Will China Disclose Its True Official Gold Reserves And How Much Is It?
Perth Mint Blog - Who Buys Precious Metal?
Zero Hedge - Central Banks Are Paralyzed At The Zero Bound
GOLD NANO-PARTICLES : The Chicago Tribune - NorthWestern Student Wins $15,000 Award
CoinWorld - Congo bullion coins being issued by Kremnica Mint in Slovakia
PHOTOS : WCVB (Boston) - See the Sketches of the Suspects, from the Interstate 95 Gold Heist
GoldMoney - Market Report: FOMC minutes turned the tide
The Mess That Greenspan Made - Easing is Easy, Hiking is Hard
Profit Confidential - National Debt Balloon Bearish for U.S. Dollar, Positive for Metals
03/26/2015 - Bullion News
Solidus Center - The Fed-Wall Street Revolving Door Must Be Shut
Alhambra Investment Partners - FOMC: Not Only Is There No Recovery, Don’t Ever Expect One
CNBC - Weak Q1 GDP may delay Fed rate hike: Jim Rickards
CITY A.M. - Coining it? The case for gold bullion coins
Reuters - LME looking to restore bullion forward curve, eyes broad market restructuring
GOLD NANO-PARTICLES : nano werk - Gold nanoparticles size up to cancer treatment
BullionStar - Euronews: If China Joins The New Gold Fix, There’ll Be Less Manipulation
Acting Man - We Now Live in a “Pimpocracy”
VIDEO : ABCNews (Australia) - Extended interview with Jim Rickards
CoinWorld - Book value of United States Treasury-owned gold tops $11 billion
The Hindu - China should boost gold reserves to 5%, says WGC
Boston Biz Journal - FBI dangles $25k for information on theft of gold headed to Massachusetts
PHOTOS : MINING - Black market gold
03/25/2015 - Bullion News
VIDEO : Next Big Trade - Bull Market Top in for the US Dollar?
TECHNICAL ANALYSIS : Kimble Charting - Euro- Time for the crash to turn into a rally?
TECHNICAL ANALYSIS : FOREX - Silver: Key Hurdles Looming for Shiny Metal
Economic Policy Journal - WSJ: The Inflation Cycle May Have Turned
GOLD NANO-PARTICLES : CNN - Fighting Cancer and Ebola with Nano-Particles
AUDIO : McAlvany Weekly Commentary - Felix Zulauf: What comes after Currency Devaluation?
SNBCHF - America Needs The Gold Standard More Than Ever
Zero Hedge - What Greece Owes, And More Importantly - When!
BullionStar - The Largest Gold Mints Of The World
The Deviant Investor - What’s Wrong With Silver?
Reuters - Fed's Evans says strong dollar 'disinflationary', possibly transitory
Zero Hedge - Don't Show Janet Yellen These 3 Charts
The Sovereign Investor - How Low Will the Dollar Go?
MarketWatch - China’s yuan may join elite money club this year
MineWeb - Kazakhstan extends gold buying spree
03/24/2015 - Bullion News
GoldReporter.de - Why the Largest Monetary Experiment of All Time will Fail - Google Translation Link
VIDEO : CNBC - BofA: Gold's going to $1,300
TECHNICAL ANALYSIS : Gold-Eagle - Gold: The Tortoise Beats The Hare
Economic Times - Platinum becomes cheaper than gold; demand up 40-50% in Indian markets in Feb-March
BullionStar - Indian Gold Import Exploding In March
GOLD NANO-PARTICLES : biotechin - Fluroescent Nano-Probes Which Light Up Tumors
CHARTS : dshort - Inflation: A Six-Month X-Ray View
Zero Hedge - This Is What The Global Economy Got For $11,000,000,000,000 In QE
Resource Investor - Wall Street losing millions from bad energy loans
Money Control - How does LBMA Gold Price fixing impact your investments
Daily Reckoning - 6 Major Flaws in the Fed’s Economic Model
TECHNICAL ANALYSIS : Market Anthropology - Old School Currency Parables
The BRICS Post - Li vows reforms to help Yuan be World’s 5th Reserve Currency
NJ.com - Recyclers try to defraud U.S. Mint with counterfeit coins from China, feds say
CDAPress (Idaho) - Treasure heist; $60,000 in gold stolen from show vendor
03/23/2015 - Bullion News
CoinNews - Gold Gains; 2015 Silver Eagles Top 11M
Perth Mint Blog - 2015 Australian Kookaburra 1oz Silver Bullion Coin Sold Out
MarketWatch - Gold and oil have a complicated relationship with the dollar
AUDIO : U.S. Global Investors - Frank Holmes : What’s In Store for Gold?
BullionStar - Will The Shanghai International Gold Exchange Facilitate Gold Inclusion Into The SDR?
AUDIO : Chris Martenson - Philip Haslam: When Money Destroys Nations
Thoughtful Cynic - Greece’s Choice (and why it doesn’t matter)
Alhambra Investment Partners - A Closer Look: Commodities
MotherBoard - Scientists Want to Mine Our Poop for Gold
National Inflation Assoc. - Fed’s Likely 2015 Rate Hike Cut in Half!
TECHNICAL ANALYSIS : Market Anthropology - Size Matters & Their Estimates are Still Too Damn High
SRSrocco Report - Important Gold Chart: Every Investor In The West Needs To See
Wealth Daily - How to Rig the Gold Market - Does the Electronic Gold Fix Matter?
Sputnik - The Dollar is Not a ‘Miracle Currency’ – German Financial Analyst
The Independent - Plastic £5 notes are going into circulation in Britain for the first time
03/22/2015 - Bullion News
Hard Assets Investor - Positive Long Term Growth Story For Gold
Daily Pfennig - Junk Silver: Don’t Let The Name Fool You
TECHNICAL ANALYSIS : SOLARCYCLES - End Of The Mania
Zero Hedge - The Next Move For The Fed: "Trial Balloning" QE4
VIDEO : StreetTalkLive - Fox 26: Why The Fed Won't Raise Rates This Year
AUDIO : Finance & Liberty - Emerging Markets Are the New Sub Prime? | David McAlvany
MoneyBeat (WSJ) - The Euro’s Going Down. If It Doesn’t Go Up.
True Contrarian - SINCE EVERYONE EXPECTS THE U.S. DOLLAR TO KEEP RISING, LOOK FOR THE EXACT OPPOSITE
Armstrong Economics - Monopoly Game & Single Tax Movement
03/21/2015 - Bullion News
Zero Hedge - Open Letter To Janet Yellen
U.S. Global Investors - What the Federal Reserve and the Fear Trade Do for Gold
StreetTalkLive - 5 Things To Ponder: What Hath The Fed Wrought
TECHNICAL ANALYSIS : CEO.CA - $8 Billion Gold Liquidation
Alhambra Investment Partners - Kill Debt to Make Debt
IBTimes - Gold prices could hit $1,200 next week on weak US dollar
BullionStar - Xinhua: China And Germany Deepen Financial Cooperation, Germany Joins AIIB And Supports RMB Inclusion Into SDR
Business Insider - The breakneck pace of the US dollar surge is something we haven't seen in 34 years
National Inflation Assoc. - Only America’s Top 10% Benefited from Fed’s QE/ZIRP
03/20/2015 - Bullion News
GoldMoney - Market Report: FOMC is boxed in
VIDEO : CNBC - Santelli: Currencies gang up against greenback
PHOTOS : CoinNews - The Difference Between Bullion & Un-circulated - America the Beautiful 5oz. Silver : Homestead Five Ounce Silver Coin Photos
Casey Research - Why Aren’t These Investors Worried About The Gold Price?
MineWeb - No Chinese banks in new London Gold Fixing system – yet
The New York Times - Richard Fisher, Leaves the Fed
GOLD NANO-PARTICLES : ChemistryViews - Nano Cancer Probes
The Mess That Greenspan Made - Conundrum 2.0
AUDIO : PhysicalGoldFund - The Gold Chronicles: Interview with Jim Rickards
GoldSeek - COT Gold, Silver and US Dollar Index Report - March 20, 2015
BullionStar - SGE Withdrawals 51t In Week 10, YTD 508t.
Arabian Money - Gold is going to take over from the US dollar as the next favorite currency for speculators
Daily Reckoning - Contagion Deja Vu by Jim Rickards
Sovereign Man - Justice Department rolls out an early form of capital controls in America
03/19/2015 - Bullion News
Things That Make You Go Hmmm - Much Ado About Nothing
GoldSeek - Why the Fed can’t raise interest rates - part 2
E-Piphany - I wonder how many times the Fed needs to be more dovish than expected before investors realize that this is a dovish Fed?
Market Watch - The dollar’s meteoric rise may be just about over
Economic Times - The way gold prices are set is changing forever
Reuters - China to allow more firms to trade gold, may impose curbs if needed
The Bullion Desk - UBS named fifth participant in new ICE gold price benchmark
The Deviant Investor - The Titanic Sinks At Dawn
PDF : U.S. Global Investors - The Optimistic Investor in a Pessimistic World
StreetTalkLive - 10 Investment Quotes To Live By
CHARTS : McClellan Financial - Global Temps Call for 2015 Yield Bottom
The Spokesman Review - Former coin shop owner gets 6 months in jail
Economic Policy Journal - The 10 Most Overlooked Tax Deductions
03/18/2015 - Bullion News
CHARTS : BARRON'S - Why Gold Will See $2,000
VIDEO : Bloomberg - Gold Demand in Asia Seen Doubling as ANZ Sees Record Prices
TECHNICAL ANALYSIS : King One Eye - Like a Thunderbolt, the U.S. Dollar Falls!
Perth Mint Blog - Perth Mint Satisfies Platinum Demand with 2015 Australian Platypus coin
IBTimes - Gold supported near five-year low ahead of change of bullion fixing system
GoldSeek - Debt, Deflation, The Dollar & Gold
MoneyBeat (WSJ) - Fed’s Covert Foray Into FX Policy Risks Wider Currency War
AUDIO : McAlvany Weekly Commentary - The U.S. Dollar Carry Trade Nightmare
GoldReporter.de - Jim Rogers is gold in wait - Google Translation Link
TECHNICAL ANALYSIS : Next Big Trade - Majority of CNBC Viewer's Expect the Dollar to Go Higher
CHARTS : CEO.CA - 4 Charts: The Fed Isn’t Hiking Rates Any Time Soon
Sovereign Man - It’s happening: more US allies join the anti-dollar alliance
GOLD NANO-PARTICLES : R&D - Improved Method for Coating Gold Nanorods
VIDEO : CNBC - Forget 'patience,' QE 4 is coming: Peter Schiff
03/17/2015 - Bullion News
MarketWatch - A Key Part of the Gold Market Will See a Major Shift Friday
Reuters - Platinum hits 5-1/2 yr low; gold eyes Fed
LiveMint - Jewellers in India jump online for $22 billion e-commerce pie
VIDEO : RT - Dragon Rising: China backed intl-bank sparks US outrage
CHARTS : Zero Hedge - Something Strange Is Going On With Nonfarm Payrolls
VIDEO : HedgEye - Is the Fed More Dovish Than Consensus Realizes?
Bullion Vault - Deflation Not Going Away
VIDEO : The Mess That Greenspan Made - Bernanke and Yellen are to Lucy as...
Daily Pfennig - Let the Fed begin...
CNBC - A shadow banking sector has gotten 65 times larger
Sovereign Man - The important lesson I learned from my Thai taxi driver
Wealth Daily - Gold Cannot be Stopped!
Daily Mail - $50,000 worth of cash and gold coins stolen from LA mansion of Grammy-winning Madonna and Beyonce songwriter

03/16/2015 - Bullion News
Economic Policy Journal - US Hits Debt Limit
National Inflation Assoc. - Domestically Held % of US Public Debt Falls to Record Low
TECHNICAL ANALYSIS : Forbes - Is Gold About To Plunge To $1,000 Or Even Lower?
The Sovereign Investor - The Markets Need to Quit Yellen
Perth Mint Blog - NEW RELEASE Australian Funnel-Web Spider Silver Bullion Coin
MoneyWeek - This simple economic principle could be huge for gold over the next few years
GOLD NANO-PARTICLES : COSMOS - A gold Trojan nano-horse that fights cancer
VIDEO : HedgEye TV - Jim Rickards Reveals What He Does Differently in Exclusive Interview With Keith McCullough
The Telegraph - Currency wars threaten Lehman-style crisis
Casey Research - 50 Shades of Gold: How to Diversify Your Gold Holdings
BullionStar - China, Gold, SDRs And The Future Of The International Monetary System
VIDEO : Kitco - Dollar Due For A Correction, All Eyes On Fed - Frank Holmes
GoldSeek - Irish Finance Minister Dumps Stocks to Buy Gold
Fairfield Citizen (CT) - Gold, Silver Bars, Guns Stolen in $200K Home Burglary
CNBC - Billionaire teams up with NASA to mine the moon
03/15/2015 - Bullion News
The Mess That Greenspan Made - The Long-Term Dollar Index
TECHNICAL ANALYSIS : The Daily Gold - Short-Term Bounce but Danger Looming
TECHNICAL ANALYSIS : CEO.CA - Gold Miners Pushed to the Brink
GoldSeek - COT Gold, Silver and US Dollar Index Report
PDF : The Gold Standard Institute - Monthly Newsletter - Issue #51
Thoughtful Cynic - Fighting the Buggers: A Defense of Gold Bugs
GoldBroker - Deutsche Bank (And Its €55 Trillion In Derivatives) Fails Fed's Stress Test
Nomi Prins - The Volatility / Quantitative Easing Dance of Doom
VIDEO : Zero Hedge - Inside The Federal Reserve: "Money For Nothing" - The Full Movie
TECHNICAL ANALYSIS : SOLARCYCLES - ZIRP vs Solar
The Corner - The dollar’s unsettling upsurge
TECHNICAL ANALYSIS : StreetTalkLive - 5 Things To Ponder: Return To Reality
IBTimes - Precious metals wrap: Dollar rally pushes platinum to six-year low, gold and silver near five-year lows
BullionStar - SGE Withdrawals 45t Week 9, YTD 456t
Sputnik - Venezuela Seeks To Monetize Its Gold Reserves Amid Severe Cash Crunch
03/13/2015 - Bullion News
TECHNICAL ANALYSIS : Next Big Trade - Is the Dollar Entering Into a Major Bear Market?
TheGoldandOilGuy - THE NEXT FINANCIAL CRISIS – Part I : Protecting Yourself with Gold, Oil and Index ETF’s
VIDEO : Silver Slacker - 2014 Perth Mint Final Lunar Mintage Numbers Released!!!
Finance and Economics - Alasdair Macleod : An Austrian Take on Inflation
The New York Times - Paul Krugman : Strength Is Weakness
Zero Hedge - Debt Ceiling Drama Is Back: Two Days Until US Borrowing Capacity Is Exhausted
Bloomberg - Surprise: U.S. Economic Data Have Been the World's Most Disappointing
Sovereign Man - Et tu, Britain? United Kingdom to join China in the anti-dollar alliance
GoldSilverWorlds - Gold To Profit From The Coming Dollar Correction
GoldCore - Gold Up 11% Euro This Year As Currency Wars Intensify
National Inflation Assoc. - Slack is Gone, Wages Begin to Rise – Massive Consumer Price Inflation is Ahead!(?)
GoldReporter.de - Euro membership cost Lithuania 1.6 tons of gold - Google Translation Link
VIDEO : Bloomberg - Gold Heads for the Longest Slump in 17 Years
MINING - These are the most bullish gold price charts you'll see today
BullionStar - Chinese Banks as direct participants in the new LBMA Gold and Silver Price auctions? Not so fast!
GOLD NANO-PARTICLES : Azonano - Light and Targeted Gold Nanoparticles Can Be Used to Activate Non-Genetically Modified Neurons
03/12/2015 - Bullion News
CHART : Financial Sense - Financial Stress and Major Market Peaks
Casey Research - Don’t Fret Gold’s Seasonal Decline
GroundReport - Palladium Set to Keep Top Performer Status among Precious Metals in 2015
GOLD NANO-PARTICLES : MedicalPhysicsWeb- Gold Nanotubes Sizzle Cancer Cells
GoldSeek - Will the Shanghai Fix fix the gold market?
Thoughtful Cynic - Did QE Really End? And Does it Really Matter?
Alhambra Investment Partners - Can We Finally Admit There Is A Serious Problem?
Contra Corner - Why The Dollar Is Rising As The Global Monetary Bubble Craters
The Deviant Investor - Silver Projection, Dollar Correction
CoinWorld - No Philadelphia Mint labels on certified 2015 American Eagle silver bullion coins without documentation
BullionStar - The Mechanics Of The Chinese Gold Market
The BRICS Post - China-IMF talks underway to endorse yuan as global reserve currency
sify - Why monetising gold might not prove easy
MINING - The stunning collapse of gold production in South Africa
03/11/2015 - Bullion News
TECHNICAL ANALYSIS : GoldSilverWorlds - The US Dollar Is Topping. When?
CoinNews - Gold Drops to 4-Month Low; US Mint Gold Sales Surge
The Gold Report - The Simple Test Tocqueville's John Hathaway and Doug Groh Use to Determine if Gold Is at a Bottom
AUDIO : FSN - Jim Rogers – Nothing Ever Really Changes
The Telegraph - Global finance faces $9 trillion stress test as dollar soars
AUDIO : Zero Hedge - Which States Have The Most Student Debt
AUDIO : McAlvany Weekly Commentary - Nothing is Permanent…Beware the Consensus!
GOLD NANO-PARTICLES : ACS - A Gold Nanoparticle-Enabled Blood Test for Early Stage Cancer Detection and Risk Assessment
CHARTS : McClellan Financial - The Real Relationship Between Dollar and Stock Market
Business Standard - Silver marks record imports in 2014
The Wealth Watchman - The Newest Casualty in the Bankers’ War on Gold and Silver
Daily Pfenning - China To Begin Gold Fixing On March 20...
BloombergView - China's Plan for Winning the Currency Wars
Inquisitr - John Schnabel: ‘Gold Rush’ Patriarch Returns To Television After Beating Cancer, Handing Off Family Business To Grandson Parker
03/10/2015 - Bullion News
VIDEO : Bloomberg - Rickards: FED Has Major Conundrum - Link to Video Above
Rick Ackerman - Why the Fed Cannot Tighten
TECHNICAL ANALYSIS : Market Anthropology - The Dollar's Perfect Storm
Bloomberg - Investors Sell Gold Holdings for 9th Day on Rate Outlook
Alhambra Investment Partners - Rational Expectations or Bubbles
VIDEO(s) : Solidus Center - Greenspan’s Insulting Admission of Fed Culpability
Investing - Who's Who Of Gold Investing
The Deviant Investor - Silver and Gold: Shelter From the Storm
VIDEO : Daily Reckoning - Avalanche Ahead: How to Survive the Monetary Collapse
INTERACTIVE GRAPHIC : The Telegraph - From bust to boom: How the world became addicted to debt
The Hindu - The India Bullion and Jewellers Association may receive ‘Gold Council’ status with the Prime Minister’s Office...
The BRICS Post - Putin signs law ratifying BRICS Bank
03/09/2015 - Bullion News
Monetary Metals - Monetary Metals Supply and Demand Report: Gold & Silver
CNBC - Is the dollar losing its clout among EMs?
MineWeb - Knives are out for gold and silver – again
CoinNews - Gold Marks First Gain in March; US Mint Gold Sales Jump
Profit Confidential - Why Ugly Inflation Is Showing Up Everywhere Except in CPI Numbers
CHARTS : Casey Research - Gold Manipulation: The “London Bias,” 1970-2014
The Union (California) - After counterfeit gold arrest, Nevada County residents hurry to verify gold, silver
TECHNICAL ANALYSIS : Acting Man - Gold and Gold Stocks Break Down Again – What to Look For
TECHNICAL ANALYSIS : Kimble Charting - King Dollar: Longest Monthly Winning Streak in History! What's Next?
VIDEO : CNBC - Does QE trigger currency chaos?
The Mess That Greenspan Made - The Jobs “Recovery”
Alhambra Investment Partners - Who Is Selling Treasuries?
QUARTZ - Can Modi unlock $1 trillion worth of gold stashed away in India’s lockers?
CEO.CA - Apple's Gold Demand is Almost Exaggerated as Much as the iWatch
03/08/2015 - Bullion News
Thoughtful Cynic - It’s (Still) Precious Metals Time
Business Insider - RAY DALIO: 'You Can't Make Money Agreeing with the Consensus View'
FOFOA - The Big Picture
TECHNICAL ANALYSIS : SOLARCYCLES - State Of The Markets
BullionStar - How The World Is Being Fooled About Chinese Gold Demand
AUDIO : GoldSeekRadio - GoldSeek Radio's Chris Waltzek talks to analyst Louise Yamada
The Telegraph - Austria is fast becoming Europe's latest debt nightmare
AUDIO : Peak Prosperity - Commissioner Bart Chilton: Price Discovery In The Commodities Markets
Sober Look - Debate Around the 2015 Rate Hike Intensifies
biiwii - King Dollar Tipping Point
CHART : Contra Corner - Fed Faces Tsunami Of Maturing Treasuries For Next 10 Years
eCommerceBytes - Coin Facts - Mint Marks
Free Shipping on Orders $199+ | 5.0 star Customer Reviews
03/06/2015 - Bullion News
TECHNICAL ANALYSIS : CFD Trading - USD Strength to Force Gold (XAU/USD) to $1000...???
Market Watch - Gold-Market Investors I Follow are Now 100% in Cash
TECHNICAL ANALYSIS : CEO.CA - Gold Takes the Elevator Down
TECHNICAL ANALYSIS : Nifty Charts - Gold Needs to Stay Above $1130 to Keep From Falling Further
Zero Hedge - Who Knew What When In Gold & Stocks This Morning?
VIDEO : Investing News - Rick Rule: 'Gold Doesn't Need to Win the War Against the US Dollar'
Solidus - Sound Money and the Ring of Truth
The Corner - Global indebtedness: the new bubble
VIDEO : CNBC - Former Federal Reserve Chairman Alan Greenspan, talks about the impact of QE on the U.S. economy and interest rates
Sputnik - Chinese Gold Fixing to Have ‘Decisive Influence’ on Global Prices
GoldSeek - The new London gold fix and China By Alasdair Macleod
SRSrocco Report - CRITICAL REASON TO OWN SILVER: Shown In This Chart
TECHNICAL ANALYSIS : GoldSeek - Clive Maund : Preparing for the Crash as Earnings Crumble and Buybacks Exhaust Themselves
Economic Policy Journal - HERE WE GO AGAIN Lew to Congress: Debt Limit Needs to be Raised ASAP
Mirror - North Korean diplomat arrested after 'attempting to smuggle £1m gold bullion into Bangladesh'
03/05/2015 - Bullion News
Futures Magazine - Oil-Gold ratio: Dial down deflation concerns
CoinNews - Gold Drops to 2-Month Low; US Gold Eagles Rise
TECHNICAL ANALYSIS : StreetTalkLive - 3 Things - New Highs, Dollar Rally, Margin Debt
TECHNICAL ANALYSIS : King One Eye - Chart of the Day -- US Dollar and Gold
The Bullion Desk - Gold price holds up well considering dollar strength
SRSrocco Report - FY 2014 Silver Eagle Dollar Sales Surpass Gold Eagles By Wide Margin
321gold - Merk Insights : Is Japan Zimbabwe?
AUDIO : FSN - Best Way To Solve A Debt Problem Is To Issue 4 Times More Debt, Right? | John Rubino
Juggling Dynamite - ECB guns for inflation or bust (further bust)
The Deviant Investor - Mr. Ponzi – Patron Saint
MineWeb - Russian palladium exports to Switzerland jump
NY Fed - From the Vault: Tracking Subprime Auto Loans
BullionStar - Chinese Gold Financing Deals Explained
GoldSilverWorlds - Ted Butler: More Evidence Of JP Morgan’s Manipulation Scheme In COMEX Silver
AUDIO : CATO Institute - Mark A. Calabria discusses auditing the Federal Reserve on Bloomberg Radio
03/04/2015 - Bullion News
CEO.CA - Gold grades declining rapidly: Dundee
Reuters - Gold market open to wide-ranging OTC trade reform: LBMA
Darien Times - Rickards: A Central Banker’s Worst Nightmare
Bullion Vault - Tilting at Gold Bugs
The Times of India - India's Finance Minister Finds Out that Monetising Gold Looks Easier Said Than Done
GoldSeek - An Ocean of Money and No One wants Gold?
CHART : Perth Mint Blog - The Perth Mint's February 2015 Gold & Silver Sales Chart
VIDEO : Technical Traders - Chris Vermeulen Gives His Technical Analysis on the Markets : S&P 500, US Dollar, Gold, Oil, etc...
GoldReporter.de - Gold investment scams? Raid on Berlin BWF Foundation - Google Translation Link
Sovereign Man - The Chinese have put out billboard ads announcing the renminbi as the new world currency
SilverCoins - Home Prices in Silver – Ounces per House
VIDEO : CNBC - Car Loans at Record High
Sober Look - The Eurozone: on the road to recovery with a lingering risk
Business Insider - The Bank of Canada is warning people to stop drawing Spock on their money
03/03/2015 - Bullion News
BloombergView - Rip Van Winkle's Bond Nightmare
CoinNews - Gold Slips for Second Day; 2015 Silver Eagles Top 9M
Alhambra Investment Partners - Swirling ‘Dollars’
AUDIO : abcNews - 911 call released in $4 million gold heist on I-95 in Wilson County
WKZO - Barclays gives information to U.S. precious metals probe
TECHNICAL ANALYSIS : Deviant Investor - The Silence of the Lambs
VIDEO : Kitco - Silver Is Headed To This In 2015 - David Morgan
SilverCoins - How to Hide Silver & Gold Coins – (Ideas)
GOLD NANO-PARTICLES : RedOrbit - Nano-Device can Eliminate Drug Resistance in Cancer Cells
AUDIO : Talk Digital Network - What is the Direction of the S&P and Commodity Markets? Interview with Chris Vermeulen founder of AlgoTrades and the TheGoldAndOilGuy.com
GoldReporter.de - How much gold is stashed in Switzerland - Google Translation Link
Profit Confidential - These Three Events Pushing U.S. Dollar Higher, but Not for Long
CHARTS : dshort - The Market Moves Higher into Overvaluation Territory
Daily Reckoning - Acronym Hell: Q4 Obliterates QE and ZIRP
Economic Policy Journal - Another Example That "There is No Price Inflation...."
03/02/2015 - Bullion News
U.S. Global Investors - FRANK TALK : Could Apple Buy a Third of the World’s Gold?
Daily Reckoning - Why the U.S. is Letting China Accumulate Gold
The Royal Mint - The Reveal of the Queen’s Fifth Coin Portrait
Casey Research - What Top Hedge Fund Managers Really Think About Gold
LiveTradingNews - Traders, Jewelers And Consumers Return To India’s Gold Market
Sunshine Profits - Gold News Monitor: China Cuts Interest Rate
Alhambra Investment Partners - Optimism/Pessimism: Stocks At Record Highs While Savings Rate Jumps
GOLD NANO-PARTICLES : nanotechweb - “Nanorattles” Reduce Tumour Size
Zero Hedge - $4 Million in Gold Bars Stolen in 11th Largest Heist in History
CoinNews - US Mint Bullion Sales Softer in February
The Corner - Concerns voiced over ECB’s QE programme
Daily Sabah - German finance chief softens tone, says Greece ‘needs time'
SRSrocco Report - MEXICO: World’s Number One Silver Producer Slips In 2014
Economic Policy Journal - Milton Friedman Turning Over in His Grave: Oakland's Minimum Wage Goes Up to $12.25 Today
TECHNICAL ANALYSIS : SOLARCYCLES - Saturation Again
03/01/2015 - Bullion News
OWNING GOLD - Umbrellas Cost More When It’s Raining. And So Does Gold.
PDF : Wizzen Trading - Technical Analysis : The Precious Metals are Trying to Find A Trend...
Inside Futures - Key Levels for Silver
AUDIO : Peak Prosperity - Grant Williams: Why The Smart Money Is So Nervous Now
BullionBullsCanada - Negative Interest Rates and Precious Metals
AUDIO : Larry Kudlow Show - Review of Friday's Meeting between Fed Chair Janet Yellen and Hard Money (Gold Standard) Economists (Review Starts @78:20 & Ends @95:51) Interview with Two of the Participants of the Meeting
INTERNATIONAL BUSINESS TIMES - India Budget 2015: Gold monetisation scheme in the works
ZAWYA - India's new gold scheme may hit Qatar market
GATA - 1968 magazine article shows how control of gold is main mechanism of imperial power
AUDIO : Financial Sense - Jim Puplava’s Big Picture: Popular Delusions and the Madness of Bankers
VIDEO : The Royal Mint (UK) - A brief history of monarchy on coins - On the 2nd of March, 2015, the Royal Mint will unveil the fifth definitive coinage portrait of Her Majesty The Queen
Bullion Star - The Bank of England and the London Gold Fixings in the 1980s
02/27/2015 - Bullion News
SafeHaven - Debt, huh, yeah; What is it good for? Absolutely nothing, uh-huh, uh-huh
Economic Policy Journal - AND IT BEGINS: Moody's Downgrades Chicago
Profit Confidential - Massive U.S. Debt ($57k+ a Person) Will Force Interest Rates Higher
CHARTS : dshort - NYSE Margin Debt Declined in January
TECHNICAL ANALYSIS : CFD Trading - Gold & Silver Moving Off Support, U.S. CPI Print In Focus
CNBC - China plans yuan-denominated gold fix this year - sources
Alhambra Investment Partners - Harmonized Inflation
MidasLetter - How Quantitative Easing Fuels Deflation and Fails to Stimulate
CEO.CA - Is Deflation Bullish for Gold?
TECHNICAL ANALYSIS : Market Anthropology - Looking Towards the Ides of March
MineWeb - HK January gold exports to China confirm strong demand
Monetary Metals - A Salvo in the Battle for the Gold Standard
Bullion Vault - Silver? Watch Gold & Base Metals
Munknee - Gold Measurements “Troy” & “Karat”: What Do They Mean?
02/26/2015 - Bullion News
TECHNICAL ANALYSIS : TheGoldandOilGuy - Money Will Rotate Into These Dead Investments
VIDEO : GoldBroker - Alan Greenspan Likes Gold: Listen up!
CHARTS : McClellan Financial - 2-Year T-Note Shows Path For FOMC
Bloomberg - Major Firms Are Saying the Stage Is Set for Another Crisis in the Bond Market
INFO~GRAPHIC : Sovereign Man - Someone please show this to Warren Buffett (Gold vs. the Financial System)
GoldSeek - Do You Have a Gold and Silver “Seat Belt”?
The Bullion Desk - Precious metals evenly grouped – gold price looks well placed
SRSrocco Report - MAJOR FACTOR FOR OWNING GOLD: The Collapse Of Gold’s EROI
Alhambra Investment Partners - New Home Sales Confirm Resales; New Home Prices Confirm Bubble
CANCER RESEARCH : Science Simplified - Graphene Oxide Neutralizes Cancer Stem Cells
MetalMiner - Platinum Dives to 5-Year Low, Global Uncertainty Produces No Rise in Precious Metals
The BRICS POST - India follows Russia, ratifies $100 bn BRICS Bank
Peak Prosperity - Time To Toss The Playbook
321gold - Merk Insights : Is Gold Risk Free?
INFO~GRAPHIC : GoldCore - EU Warns of “Macroeconomic Imbalances” and Debt Dangers in EU Economy and Ireland
Kitco - Increase In Eurozone Gold Reserves Not From New Purchases – Macquarie
PLATTS - China's 2014 spot gold trade volume soars near 60% on year to 18,486 mt
The Bullion Desk - Chinese imports of gold from HK at net 72 tns in January
Bullion Star - 1973 EU CB’s Traded Gold In Secret At Free Market Price
CHARTS : dshort - A Long-Term Look at Inflation
02/25/2015 - Bullion News
Numismaster - Any Competitors for Silver Eagle Bullion Coins?
INFO~GRAPHIC : Visual Capitalist - The Silver Series: Who Controls The World’s Supply? (Part 2 of 4)
VIDEO : CNBC - Jim Grant: The 'virus' of radical monetary policy
The Corner - Central bankers waiting to see who will jump first
Bullion Star - Austria Expresses Concern Over Their Gold At BOE
Perth Mint Blog - Elegant New Card Coming For Kangaroo Minted Gold Bars
CoinWeek - State of the Mint – U.S. Mint Coin Sales...
AUDIO : McAlvany Weekly Commentary - Controlled Interest Rates: The NEW Weapon of Theft
Zero Hedge - Ukraine Enters Hyperinflation: Currency Trading Halted, "Soon We Will Walk Around With Suitcases For Cash"
CATO Institute - Ukraine Hyperinflates
GoldCore - 12 Reasons Why Ritholtz and Many Experts Are Mistaken On Gold
The Economic Collapse - Why Does Maryland Have The Most Millionaires Per Capita? The Answer Might Make You Angry
Sovereign Man - Chinese reduce their holdings of US Treasury bonds for the fourth consecutive month
02/24/2015 - Bullion News
National Inflation Assoc. - Shocking Disney World Price Inflation
CoinNews - Gold Falls for Third Session; US Coin Sales Rise
VIDEO : RT - Jim Rickards on Fed Chair Janet Yellen and The Strong Dollar
Dollar Collapse - Lowest Interest Rates EVER
VIDEO : Kitco - It's Clear Why Gold Should Be Better - Jim Grant
Market Watch - U.S. probing big banks over pricing of gold, other metals
BloombergView - Metal Manipulation and Negative Rates
Deviant Investor - Gold: The Good, Bad, and Truly Ugly
CHARTS : Futures Magazine - Why bad news is good news in Europe — 7 charts showing you what you really need to know
MineWeb - Kazakhstan adds gold for 28th straight month
Reuters - India seizes record haul of smuggled gold outside airport
02/23/2015 - Bullion News
CoinNews - Gold Slips, 2015 Silver Eagles Top 8M
CHART : GoldSilverWorlds - COMEX Gold Analysis – Has Gold Bottomed?
VIDEO : CNBC - A Bottom in Gold?
TECHNICAL ANALYSIS : CEO.CA - This is the Key to the Next $100 Move in Gold
CATO Institute - Does Fed Leverage and Asset Maturity Matter?
Mish's Blog - Beggar Thy Taxpayer: Currency Wars, QE Strain Life Insurers and Pension Plans; Negative Returns With 4-7% Promises
GoldBroker - Alan Greenspan: Gold Price Will Be “Measurably Higher”
The Standard - Gold link on track - direct trading of gold between Hong Kong and Shanghai should kick off as early as June this year
Bullion Star - SGE Chairman: India Will Become SGE’s Largest Partner
VIDEO : Sprott Money - Ask The Expert - Hugo Salinas Price
FXStreet - Kicking The Can Down The Road
Market Watch - 10 reasons U.S. stocks may see a 10%-20% correction by July
Mlive - Confederate treasure in Lake Michigan? Despite skeptics, divers pursue fantastic story
Sputnik - Bankers Rally Against ‘Audit the Fed’
02/22/2015 - Bullion News
Business Insider - The US dollar is the most crowded trade in the world
PDF : Wizzen Trading - Technical Analysis : Stocks Rocking While Metals Stay In Downtrends
International Man - What You Need to Know About Russia, Putin, and Gold
GOLD NANO-PARTICLES : R&D - Shape-shifting groups of nanorods release heat differently
VIDEO : The Daily Coin - Weight For It: Sizing Up The RCM Silver Animal Series
Reuters - South African gold miners rescued after a fire at Harmony Gold
The New Indian Express - 12 Arrested for Duping Women of Gold, Silver
02/21/2015 - Bullion News
Zero Hedge - "The Smart Money Is Selling, Not Buying" Goldman Warns With Valuations In The "99th Percentile"
Institutional Investor - Daily Agenda: The Week Ahead February 23rd - 27th, 2015 - Fed chairwoman Janet Yellen testifies before Congressional committees; three key U.S. housing market data points on deck.
Federal Reserve Bank of NewYork - Household Debt Continues Upward Climb While Student Loan Delinquencies Worsen
Gold-Eagle - U.S. dollar net longs shrink to smallest since late December -CFTC, Reuters
Ahead of the Herd - Duck Quacks and Golden Echo’s
AUDIO : Library of Economics & Liberty - Benn Steil on the Battle of Bretton Woods
Bullion Vault - Greek Bankruptcy Hits Neocolonial Finance
Forbes - Why Gold Is Looking Lustrous Once Again
Bloomberg - Russia Stops Gold-Buying Spree After Prices Soared in January
VIDEO : The Telegraph - Watch: Divers find huge hoard of 1,000-year-old coins on Israel sea bed
GoldCore - Gold Bars In France Worth EUR 450,000 Robbed From Pensioner By Fake Cops
NGC - Rare Mint Error Found on a 2015 Silver Eagle Bullion Coin
CoinNews - 2016 Red Book of U.S. Coins Available March 26
02/20/2015 - Bullion News
U.S. Global Investors - Mind-Blowing: China Consumes More Gold Than the World Produces
sify - India's Gold Imports May Rise to 35-40 Tonnes in February
NFTRH - Gold and Silver CoT
Profit Confidential - Derivatives: The $563-Trillion Reason to Look at Gold
Zero Hedge - Why The "1%" Hates The Gold Standard
VIDEO : Vision Victory - Gold and the Dollar are at War - Rick Rule Interview
Reuters - Platinum reaches biggest discount to gold in nearly two years
GOLD NANO-PARTICLES : Bio Optics World - Hybrid gold nanoparticles could pair cancer imaging, therapy
Sovereign Man - Meet the bureaucrat who had the courage to tell the truth (and probably won’t have a job tomorrow)
Dollar Collapse - Greece Is Fixed! Oh, Wait...
AUDIO : TF Metals Report - A2A with Patrick Heller of Liberty Coin Service
The Economist - The Royal Mint : Coining it
SRSrocco Report - AMAZING SILVER CHART: Investors Overwhelming Prefer Physical Over Paper Silver
MINING - Here's one hedge fund not bailing on gold

02/19/2015 - Bullion News
McClellan Financial - Architecture Billings Index Flashes Warning
Peak Prosperity - How Many More “Saves” Are Left in the Central Bank Bazookas?
The Bullion Desk - Reserve Bank of India Scraps Ban on Gold Coin Imports
TECHNICAL ANALYSIS : Nifty Charts - GOLD Daily at golden ratio
TECHNICAL ANALYSIS : CFD Trading - Technical Picture In Gold Outshines Silver & Platinum
MoneyBeat (WSJ) - March Date Set For Gold Fix Switch
VIDEO : Stefan Molyneux - A Conversation with G. Edward Griffin, author of "The Creature from Jekyll Island"
GOLD NANO-PARTICLES : nano werk - Near-Perfect Anti-Bacterial Nano-Materials
Fox Business - Gold Rises Amid a World Full of Risk and Uncertainty
AUDIO : Gordon T Long - Gordon T Long Inteviews Marc Faber
Bullion Star - SGE Withdrawals 59t in week 6, YTD 374t: Chinese Gold Soap Extended Another Season
Deviant Investor - Silver and Gold: Why Now?
AUDIO : McAlvany Weekly Commentary - The Greeks: Is it a Game of Chicken or a Forfeit?
GoldSeek - Gold: The Dollar Reigns Supreme . . . But For How Long?
02/18/2015 - Bullion News
CoinNews - Gold Bounces from 7-Week Low After Fed Minutes
Zero Hedge - FOMC Minutes Show Patient-er-For-Longer, "Foreign Risks"-Fearful Fed
Business Insider - The Fed is worried about what happens when everyone rushes for the exit
Economic Policy Journal - The Crony Meetings of Fed Chair Janet Yellen
CoinNews - 2015 Homestead 5 Oz Silver Bullion Coin Launches
VIDEO : GoldSeek - GoldSeek Exclusive Video Syndication: The Real Cost of Mining Gold: Part 1
MineWeb - Global silver production up 3.8% in 2014
TECHNICAL ANALYSIS : DailyFX - Palladium Consolidates as a Demand Surge Counters Mining Recovery
AUDIO : Talk Digital Network - Interview with David Morgan about his New Book for Silver Investors : "Silver Manifesto"
Gold-Eagle - Gold And Russia
INFO~GRAPHIC : Visual Capitalist - The 10 Countries With the Most Gold Reserves
AUDIO : GoldCore - Gold Essential “Safe Haven” Due to Greece … Spain, Italy, Ukraine, Lehman and “Bad Stuff”
TECHNICAL ANALYSIS : Market Anthropology - Markets on Wire
The Mess That Greenspan Made - How Non-Housing Debt Has Changed
Forbes - Social Security Could Be In Worse Shape Than We Thought
02/17/2015 - Bullion News
TECHNICAL ANALYSIS : Kitco - Gold Plunges, Heading Toward Key "Line In The Sand"
Market Watch - 7 Charts that Suggest the Rising Stock Market May be Wrong
Bullion Star - Koos Jansen vs WGC/GFMS/CPM Update
GoldSeek - SWOT Analysis: China is Effectively Consuming all of the World’s New Mined Gold Supply
PDF : Gold Standard Institute - The Gold Standard - Issue #50
AUDIO : PhysicalGoldFund - The Gold Chronicles: February 9, 2015 Interview with Jim Rickards
GOLD NANO-PARTICLES : nano werk - Plasmonic Nano-Crystals for Combined Photo-Thermal and Photo-Dynamic Cancer Therapies
Bloomberg - Greek Banks Need More Emergency Funds
The Deviant Investor - Silver and Gold: Why Now?
AUDIO : FSN - Chris Vermeulen – Gold Still in a Bear Market, but Don’t Lose Hope
PDF : World Platinum Investment Council - Platinum Supply & Demand - Platinum Quarterly
Juggling Dynamite - Assault on democracy: big banks controlling ‘journalists’
GRAPHIC & VIDEO : New York Fed - Change in Home Prices
Fox News - Largest trove of gold coins in Israel unearthed from ancient harbor
02/16/2015 - Bullion News
Acting Man - Misconceptions About Gold
TECHNICAL ANALYSIS : CEO.CA - Silver Heading for Major Test
CNBC - Greece defies creditors, seeking credit but no bailout
Zero Hedge - The Greeks Are Running Towards Gold As The Retail Demand Increases By 123%
TraderPlanet - Resolved: The Fed's QE Polices Were Bad For Business … And Everybody Else
Cayman Financial Review - The GSEs, the financial crisis and the Dodd-Frank Act - Excellent Read
AUDIO : The Daily Gold - Interview with Palisade Radio
NANO-PARTICLES : SPIE - Colloidal Nanoparticles for Heterogeneous Catalysis
Daily Reckoning - Attention to Deficits Disorder
TECHNICAL ANALYSIS : Action Forex - XAU/USD Manages To Cross Resistance At 1,230
Casey Research - Dear Harry Dent: Wanna Bet?
VIDEO : Gordon T Long - Gordon T. Long has a Market Discussion w/ Lacy Hunt
GoldSeek - Thoughts from the Frontline: Mamas, Don’t Let Your Babies Grown Up to Be Pension Fund Managers
The Daily Coin - Ted Butler: A Remarkable Proposition
02/15/2015 - Bullion News
Juggling Dynamite - The Myth of Black Swan market events
VIDEO : TraderPlanet - Technical Analysis of the US Dollar, Gold and Currencies
AUDIO : Peak Prosperity - David Stockman: The Global Economy Has Entered The Crack-Up Phase
South China Morning Post - Gold demand forecast to rebound in 2015
CNN Money - Here's what to really fear about the stock market...
The Corner - Swedish central bank: “The sins of the father”
Bullion Star - The IMF’s Gold Depositories – Part 2, Nagpur and Shanghai, the Indian and Chinese connections
CoinDesk - Bitcoin ATM Selling Gold and Silver Goes Live in Singapore
Laissez Faire - URGENT: Sell Everything, Buy… Nickels?
02/13/2015 - Bullion News
The Daily Bell - Fed Under Attack Again – This Time From One of Its Own
TECHNICAL ANALYSIS : Market Anthropology - Sizing up the next moves in the Market
Numismatic News - Will Uncle Sam get your IRA? by Pat Heller
GoldMoney - Unemployment and Group-Think
GOLD NANO-PARTICLES : PHYS.org - Gold nanotubes launch a three-pronged attack on cancer cells
Market Watch - Dollar sinks for third week in a row
Dollar Collapse - Gold In A Negative Interest Rate World
Perth Mint Blog - Indispensable Silver
Bullion Star - SGE Withdrawals 59t in Week 5, YTD 315t. What is China Up To With All This Gold?
Reuters - Valuations of Chinese gold miners surge, defying dull gold price
Kitco - The U.S. Dollar Is Not A Safe Haven – Jim Rogers
Silver Doctors - THIS IS THE WOMAN REVOLUTIONIZING PRECIOUS METALS
itv - Largest ever 'perfect' 100-carat diamond worth £16 million arrives in London ahead of spring auction in New York
02/12/2015 - Bullion News
GoldSilverWorlds - Central Banks Purchase Gold To Diversify From The US Dollar
TECHNICAL ANALYSIS : McClellan Financial - Crude Oil Leads the Euro
TECHNICAL ANALYSIS : Bullion Star - Is The $/Yen About To Take A Swan Dive?
Gold-Eagle - Dollar Weakening After Disappointing Economic Reports
Alhambra Investment Partners - When ‘Deflation’ Reveals ‘Inflation’
VIDEO : CNBC - Summers: Why the Fed Should Not Raise Rates
Zero Hedge - "Fed" Or "Fundamentals" - You Decide
The Daily Bell - What the Price of Gold Says About Central Bankers
Economic Policy Journal - WOW India Passes China to Become Fastest-Growing Economy
CommodityHQ - Palladium Flying Under the Radar
Bullion Vault - Gold Mining 'Peaks, Will Plateau in 2015' on Low Margins, Spending
AUDIO : FSN - David Morgan – Precious Metals Still Make Sense
Casey Research - Doug Casey on ISIS, Gold, Oil, and What to Expect in 2015
CoinWeek - The Royal Canadian Mint Has a New “Master” and Board Chair
02/11/2015 - Bullion News
Alhambra Investment Partners - The Reality of ‘Flow’
Bloomberg - Swiss Bank Says Investors Favor Gold Amid Charges on Cash
Money Week - Technical Signal Not Seen Since 2009, is Now Showing Up on Gold's Monthly Chart
Bullion Vault - China's Silver Demand 'Peaked 2013, Not 2010'
FOFOA - Confessions of an Erratic Marxist
GOLD NANO-PARTICLES : FBIG - 2nd Cancer Research Update
GOLD NANO-PARTICLES : World Bulletin - Egypt researchers claim to treat cancer with gold
SRSrocco Report - 2015 SILVER EAGLE INVESTMENT DEMAND: Continues To Be The Big Winner
Mining Weekly - Fuel cells, cleaner fuel to create new platinum demand
CNBC - Fisher floats Fed changes to fix New York, Washington bias
Project Syndicate - An Accidental Currency War?
VIDEO : Sprott Thoughts - Eric Sprott: Expect Physical Gold Backing of Currencies Within Next Decade
The Diplomat - China, India To Lead World By 2050, Says PwC
Fun Times Guide - What Are Error Coins? How Much Are Coin Mistakes Worth?
02/10/2015 - Bullion News
Daily Reckoning - Unprecedented Central Bank Policies Call for a “Barbell Strategy”
Scrap Monster - Indian Trade Ministry solicits drastic tax cut on gold imports
VIDEO : Talking Numbers - Two Different View Points on the Gold Market's Future
CEO.CA - The Only Chart of Gold You Need
VIDEO : Zero Hedge - This Man Will Never Be Invited Back On CNBC
MoneyBeat (WSJ) - The Missing Wage Jolt
Business Insider - These countries own most of US foreign debt
GOLD NANO-PARTICLES : FirstWorld MedTech - Nanovectors Combine Cancer Imaging and Therapy
The Deviant Investor - Silver and Gold Truth Versus Fiat Lies
AUDIO : Talk Digital Network - Silver Oversold at Record Level
Bullion Star - The Keys to the Gold Vaults at the New York Fed – Part 3: ‘Coin Bars’, ‘Melts’ and the Bundesbank
Project Syndicate - The Greek Austerity Myth
Provident Metals - Millions Worth of Gold and Silver Down the Drains?
The Independent - Largest hoard of Anglo-Saxon coins found in recent years goes on display at British Museum !
02/09/2015 - Bullion News
VIDEO : MoneyBeat (WSJ) - Interview with Richard Dobbs of McKinsey & Co. - Turning on the Gas: Global Economies Add $57 Trillion in Debt
VIDEO : Gordon T Long - MACRO ANALYTICS - The Next Peg To Fall - w/ Charles Hugh Smith
Bullion Vault - QE's Special Sauce
VIDEO : CNBC - Santelli eyes key level in EURUSD=X
Zero Hedge - Fearing Grexit, Greeks Turn To Gold Again
Bloomberg - Six Countries Where Inflation Is Surging
Bullion Star - Second Thoughts On US Official Gold Reserves Audits
VIDEO : Algo Trades - Chris Vermeulen Market Update
02/08/2015 - Bullion News
02/08: Sprott Thoughts - Rick Rule: Gold Is Beginning to Lose Less Badly Against the US Dollar
Investor Intel - In Memory of Gene Arensberg: the “Vulture King” : Founder of the Got Gold Report
VIDEO : Forex Video Zone - Technical Analysis : Gold Market Trend-Lines to Watch this Week
VIDEO : TraderPlanet - Technical Analysis : US Dollar, Gold & Currencies...
GoldSeek - COT Gold, Silver and US Dollar Index Report - February 6, 2015
Sober Look - Improvements in the euro area credit conditions should not be ignored
OilPrice - Palladium : Is This Crisis Metal Today's Best Resource Opportunity?
INFO~GRAPHIC : GoldSilver - Why the Dollar May Not BE All-Powerful
PHOTOS : MINING - Dump trucks hoisted, frozen, tipped and sunk
02/07/2015 - Bullion News
02/07: Bloomberg - America's Dollar, the World's Problem
TECHNICAL ANALYSIS : StreetTalk - 5 Things To Ponder: Intriguing Erudition
Gold Reporter.de - Silver Trading: CME Group raised margins again - Google Translation Link
VIDEO : Economic Policy Journal - The Fed Manipulated Boom is On: January 2015 is the First Positive Economic Confidence Index Number in at Least Seven Years
The Reporter - Consumer debt jumped last month
China Daily - China, EU aim to increase investments in ICT markets
BBC - Bank of England holds rates at 0.5%
REWIND : VIDEO :
TECHNICAL ANALYSIS : SOLARCYCLES - Not So Different After All?
TheGoldandOilGuy - The S&P 500 Is Going Lower . . . Sooner Rather than Later
02/06/2015 - Bullion News
Daily Reckoning - The Dollar Will Die with a Whimper, Not a Bang
- by James Rickards
MINING - Jobs Report Hammers Gold
Economic Policy Journal - Breaking: Janet Yellen Testimony on Capitol Hill Coming
CNBC - Fed 'Running Out of Excuses' for Zero Rates
Brisbane Times - Gold Bug Peter Boehringer Lifts Lid on Germany's Missing Bullion
Mises Institute - Is Russia Planning a Gold-Based Currency?
GOLD NANO-PARTICLES : nano werk - Nanovectors Combine Cancer Imaging and Therapy
The Business Times - China's 2014 gold demand slides 25% after 'extraordinary' year
Bullion Star - Total SGE Withdrawals 255t In January, Up 4 % y/y
Gold Market Macro - Central Banks can’t stimulate demand and will ruin their currencies trying
Alhambra Investment Partners - Gold Turned Upside Down
Bloomberg - Currency Devaluations Are an Undeclared War
VIDEO : DailyFX - Technical Analysis : Which Has More to Lose/Gain Between Dollar and SPX?
CoinNews - US Mint 2016 24K Gold Coins to Celebrate 1916 Designs
02/05/2015 - Bullion News
McKinsey & Company - Debt and (Not Much) Deleveraging - Seven years after the bursting of a global credit bubble resulted in the worst financial crisis since the Great Depression, debt continues to grow.
Zero Hedge - Dollar Tumbles On Sudden Stop Hunt
Gold-Eagle - Gold-Silver: Long-Term Relationship Challenged
MoneyNews - Buffett Says Tough for Fed to Lift Rates Given Strong Dollar
TECHNICAL ANALYSIS : Market Anthropology - Traders: Sell Stocks & Bonds - Buy Gold & Silver
The Diplomat - Kazakhstan and the Emerging Market Gold Rush - Astana, Moscow and Beijing are among those buying gold in reaction to a thriving dollar.
Hussman Funds - Market Action Suggests Abrupt Slowing in Global Economic Activity
The Gateway Pundit - Gallup CEO: Number of Full-Time Jobs as Percent of Population Is Lowest It’s Ever Been
Bullion Star - Belgium Denies To Repatriate Gold From The UK
Zero Hedge - Spot The Gold One Out
Perth Mint Blog - China To Support Silver Market In 2015
Bloomberg - Gold Imports by India Said to Surge This Year as Curbs Scrapped
Sun Sentinel (Florida) - Four precious metal businesses banned from trading
CoinNews - Perth Mint Bullion Sales Mixed in January
Market Watch - Chinese herdsman stumbles onto a 17-pound gold nugget
02/04/2015 - Bullion News
Alhambra Investment Partners - The Hard Work Of Strong Dollars
The Gold Report - What the Aden Sisters Are Watching Before Jumping Back into Natural Resources
TECHNICAL ANALYSIS : CME Group - Oil-Gold Ratio: Dial Down Deflation Concerns
GOLD NANO-PARTICLES : Health Canal - Gold nanoparticles show promise for next generation anti-arthritic drugs
AUDIO : McAlvany Weekly Commentary - Fed: “Let’s Penalize Unspent Cash”
VIDEO : Wall Street Pit - Fed Would Be Crazy to Raise Rates Now
VIDEO : CEO.CA - This hedge fund heavyweight could be holding US$6 billion in gold
CHARTS : dshort - Market Valuation Overview: Lofty, But a Bit Lower Than Last Month
TECHNICAL ANALYSIS : SOLARCYCLES - The Old Rules
Zero Hedge - Bulls Beware: Dennis Gartman Just Flip-Flopped To Bullish... Again
02/03/2015 - Bullion News
Zero Hedge - Rates Don't Matter - Liquidity Matters
My Budget 360 - The largest bracket of tax payers in the United States is made up by those making $15,000 a year or less
Economic Policy Journal - US Government Interest Costs are Poised to Surpass Defense and Non-Defense Discretionary Spending
GoldReporter.de - Why gold will win the currency war! - Google Translation Link
Sovereign Man - Three Slides That Will Challenge Everything You Think About Investing
TECHNICAL ANALYSIS : Kimble Charting - Dollar & Euro ripe for reversals due to this
CNBC - 'Currency war' to be 'lose-lose' game: Strategist
Daily Reckoning - Lies, Damned Lies, and Central Bank Forecasts - by James Rickards
PIMCO - New Neutrals, Fat Tails and Distorted Markets
Deviant Investor - Exponential Explosions in Debt, the S&P, Crude Oil, Silver and Consumer Prices
GoldBroker - Five Reasons to Buy Gold and Silver in 2015
Resource Investor - No Transparency in New Gold Fix
AUDIO : Midas Letter - Interview with Rick Rule
Bullion Baron - Reserve Bank of Australia & The Missing Bar Numbers
02/02/2015 - Bullion News
Alhambra Investment Partners - Less Than Zero
Daily Reckoning - James Rickards : Nine Years on, People Forget How Nasty a Rate Increase Can Be
NFTRH - Gold & US Banks; a Critical Juncture
TECHNICAL ANALYSIS : King One Eye - Important Charts of Silver and Gold
CoinNews - US Mint Bullion Coins Rally in January Sales
VIDEO : CNBC - Rick Santelli & Charles Biderman Discuss the 'No-Growth' Economy
The Gold Report - Contrarian Economist John Mauldin: How to Position Your Portfolio to Win in the Currency Wars
Market Watch - ICE Benchmark Administration to Administer the LBMA Gold Price from March 2015; LBMA Gold Price to replace the London Gold Fix
Bloomberg - Chinese Banks in Talks to Take Part in Gold Fix Replacement
Rick Ackerman - Fed Managing Expectations of Only the Gullible
Zero Hedge - That Feeling That Something Dramatic Is About To Happen
VIDEO : CNBC - Venezuela's Debt Crisis : A View of What Happens When the Government Attempts To Take Total Control of Your LIFE
Perth Mint Blog - Are Analysts Overly Pessimistic About Gold And Silver in 2015?
INFO~GRAPHIC : Visual Capitalist - With Investing, Little Things Make a Big Difference
AUDIO : GoldSeekRadio - Interview with Steve Forbes
02/01/2015 - Bullion News
Gold-Eagle - A Look At Gold And Silver For 2015 And Beyond
PDF : Wizzen Trading - Technical Analysis : Beautiful Gold Action
Bullion Star - GFMS Reports Chinese Gold Trade Volume Incorrect By 100%
Economic Policy Journal - Becoming Professionally Estranged: From Samuelson to Friedman to Mises and Rothbard
Daily Reckoning - How Capitalism Dies
GOLD NANO-PARTICLES : Future Medicine - Laser-Induced Explosion of Gold Nano-Particles: Potential Role for Nano-PhotoThermolysis of Cancer
Bullion Star - Federal Reserve New York Gold Withdrawal Numbers 2014 Don’t Match Dutch-German Repatriation Claims
Project Syndicate - Nouriel Roubini : An Unconventional Truth
AUDIO : Financial Sense - Jim Puplva’s Big Picture: The Risk of a Rising U.S. Dollar
E-piphany - Crazy Spot Curves – Orderly Forwards
AUDIO : Peak Prosperity - Nomi Prins: The Sinister Evolution Of Our Modern Banking System
Gold-Eagle - Red Gold Called Copper…The ‘Dark Horse’ Among Precious Metals
Global Financial Intelligence - Mexico 2014: Demand Fell Ounces of Silver - Google Translation Link
01/31/2015 - Bullion News
TECHNICAL ANALYSIS : The Daily Gold - Impending US$ Peak Should be Catalyst for Gold
Monetary Metals - Monetary Metals Brief 2015 by Keith Weiner
CoinWorld - Royal Canadian Mint releases Hawk and Cougar bullion coins
Gold Chat - Repatriation Update
Sprott Thoughts - Jayant Bhandari: Don’t Expect India’s Gold Imports to Surge on Tariff Cuts
VIDEO : Bloomberg - Margin Debt Levels: A Good Market Indicator?
Sputnik - China Passes US to Become World's Top Foreign Investment Destination
The New York Times - The Dangerous State of Americans’ Savings
MyWebTimes - Treasure in Pocket Change
Wealth Daily - Where to Find Yield - The Fed Has Made it Tough
The Telegraph - What was the SS Central America - or 'Ship of Gold' - and why did it sink?
NBC29 - VA Senate Panel OKs Tax Break for Bullion Buyers
01/30/2015 - Bullion News
Cayman Financial Review - Gold and Silver are Alternative Assets
Forbes - When Even the Fed Is Confused About Gold, We Still Have Some Work To Do
GoldReporter.de - Silver Trading: CME Group requires greater security - Google Translation Link
TECHNICAL ANALYSIS : Nifty Charts - SILVER Support and Resistance levels
GoldSilverWorlds - Gold: COT Report Flashes Yellow Flag
NANO-PARTICLES : City of Hope - Destroying Brain Tumors with Nano-Particles
Economic Policy Journal - Disability Trust Fund Will Run Out of Money By the End of 2016
Zero Hedge - Janet Yellen Now Advises Democrats What The Fed's Monetary Policy Plans Are
Bloomberg - Bullard Warns of Asset Bubble Risk If Fed Keeps Rates Too Low
Zero Hedge - What Happens When The Markets Realize This...?
Bullion Star - BOOM: SGE Withdrawals Week 3, 2015: 71 tonnes!
Reuters - CME Raises Margins for Platinum
CoinWeek - The Coin Analyst: Collectors Crying Over Milk-Spotted American Silver Eagles
VIDEO : Stack Smart - Silver Stacking for beginners - 4 tests to check if a silver coin is a FAKE!
01/29/2015 - Bullion News
CHART : McClellan Financial - Dollar Is Wandering Off Track
TECHNICAL ANALYSIS : Kimble Charting - U.S. Dollar Towers Above its 200 Day Moving Average
TECHNICAL ANALYSIS : GoldSilverWorlds - Gold Price Pulls Back And Tests 200 Day MA
VIDEO : RT - Sprott's Rick Rule on Natural Resources
Bloomberg - Gold Caps for Biggest Drop Since 2013 as Silver Plummets
MineWeb - U.S. 10 month Gold Mine Output Falls 7% y/y
RADIO-WAVE THERAPY & NANO-PARTICLES : Nature India - Graphene Tames Drug-Defying Blood Cancer Cells
CHARTS : Advisor Perspectives - Forecasting Q4 GDP: A Look at the WSJ Economists' Collective Crystal Ball by Doug Short
VIDEO : Bloomberg - Fed Must Change Rate Hike Rhetoric Soon: Ellen Zentner
VIDEO : CNBC - David Stockman: Fed Made Up of 'Cowards'
VIDEO : Kitco - Currency Wars: “I Am very Worried” – Jim Wyckoff
The Blaze - When ‘Quantitative Easing’ Causes Uneasiness
CATO Institute - Pentagon Spending and Bureaucratic Bloat
Market Update - Russia in 2014 was the largest buyer of gold - Google Translation Link
CoinNews - NASA Space-Flown Gold Sells for $1,373 Per Oz
01/28/2015 - Bullion News
Economic Policy Journal - 'Two Percent Inflation' and The Fed's Current Mandate
The Globe and Mail - Invest like a legend: Seymour Schulich - Co-Founder of Franco-Nevada
TECHNICAL ANALYSIS : Action Forex - XAU/USD Increase Limited By Resistance At 1,290
VIDEO : Cambridge House - Rick Rule : Gold is in a War with the US $Dollar
Marc to Market - Too Quick to Exaggerate SWIFT Data - The use of the yuan surpassed the Australian and Canadian dollar to move into fifth place, but the yuan's share is only 2.17% of global payments by value.
Reuters - Palladium to outperform in 2015 as platinum deepens losses: Reuters poll
CHARTS : StreetTalkLive - The Market is Currently a "Bug in Search of a Windshield"
Bullion Vault - Gold Manipulation? 'No Sign, Case Closed,' Says Germany's BaFin
VIDEO : CNBC - Will the Fed drive gold higher?
TECHNICAL ANALYSIS : SOLARCYCLES - Charts Updates
Market Watch - Why negative bond yields are good news for gold
Zero Hedge - Jeff Gundlach Warns "The Fed Is About To Make A Big Mistake" (& That's Why Bond Yields Are Crashing)
Bullion Star - The Keys to the Gold Vaults at the New York Fed – Part 1
Bullion Star - The Keys to the Gold Vaults at the New York Fed – Part 2
AUDIO : GoldSeek Radio - Interview with Commodities Guru - Jim Rogers
01/27/2015 - Bullion News
U.S. Global Investors - There’s More to the Gold Rally Than European Market Fears.
King One Eye - Don't Panic! Today's Must-See Charts on Earnings -- And How to Save Your Sorry Hide
Bloomberg - Stronger Dollar Punishes U.S. Earnings From P&G to DuPont
Numismatic News - New Tactic Used To Combat Fake ENGELHARD Bars
VIDEO : Smart Stack - Technical Analysis : Silver Price Analysis 27/012015 - Brilliant Brittanias - Golden Greeks
Market Realist - Why You Should Own Gold: The Diversification Angle
Dollar Collapse - This Is What It Means To Lose A Currency War
Mauldin Economics - Income Inequality? American Savers Treated Like Dogs
CHARTS : The New York Times - The Shrinking American Middle Class
The Mess That Greenspan Made - The Increasingly Unequal States of America
INFO~GRAPHIC : Visual Capitalist - The Cost of Living Around the World
SRSrocco Report - U.S. GOLD EXPORTS TO HONG KONG & CHINA : Doubled In October
Bullion Star - Netherlands Did Not Increase Gold Holdings In December
The Bullion Desk - Thailand to launch physical gold exchange
Profit Confidential - Two Factors to Continue Pushing Gold Prices Higher in 2015
01/26/2015 - Bullion News
CoinNews - Gold Slips, Jan 2015 Silver Eagle Sales Top Jan 2014
TECHNICAL ANALYSIS : Nifty Charts - GOLD Trend update
TECHNICAL ANALYSIS : Edge Trader Plus - Gold And Silver – Around The FX World In Charts
Market Realist - Why Gold Out-Performed Other Assets Recently
The Hindu - Swiss Bullion Exports to India Nearly Treble
TECHNICAL ANALYSIS : GoldSilverWorlds - Why Gold Is Set To Move Higher
GOLD NANO-PARTICLES : Korea IT Times - Attracting Cancer Cells by Using Innocuous Gold or Silver Nano-Particles
GOLD NANO-PARTICLES : PHYS.org - Nano scale research could yield better ways to identify and track malignant cells
TECHNICAL ANALYSIS : CEO.CA - Gold in Euro Terms Set for Correction
CHART : King One Eye - Today's Must-See Chart #1: King Dollar
TECHNICAL ANALYSIS : Acting Man - Gold at an Interesting Juncture
CHART : The Mess That Greenspan Made - The Fed’s “smooth, fully anticipated, glide path towards a June lift off” now in doubt
Bloomberg - CME Starts Gold Futures in Hong Kong in Price-Benchmark Race
Coin Update - New Effigy of Queen Elizabeth II To Be Unveiled March 2nd
Affiliate Ad
01/25/2015 - Bullion News
Cyprus Mail - Oil, Gold and Debt
PDF : Wizzen Trading - And Just Like That, It All Changed
The Guardian - Devaluation and discord as the world’s currencies quietly go to war
VIDEO : StackSmart - Technical Analysis : Surging silver - Cracking Kilo Kooks
Gold-Eagle - Grandmaster Putin’s Gold Trap: Russia Is Selling Oil And Gas In Exchange For Physical Gold
AUDIO : Peak Prosperity - Axel Merk: Why Asset Prices Must Return To Lower Levels
VIDEO : Zero Hedge - "This Is A Race To The Bottom Where No Fiat Currency Wins"
The New York Times - The Strong Dollar Is Always Good, Except When It Isn’t
Bloomberg - America's Losing the Currency War
VIDEO : BNN - Marc Faber : Feckless Central Banks to Underpin Gold
TECHNICAL ANALYSIS : Juggling Dynamite - Copper Cracks
VIDEO : Bloomberg - Bill Gates: QE Helps Debtors at Savers' Expense
01/24/2015 - Bullion News
CoinNews - Gold Advances on Week; US Mint Bullion Coin Sales Slower
TECHNICAL ANALYSIS : The Daily Gold - Gold Maintains Strength while Large Miners Reach Resistance
TECHNICAL ANALYSIS : Inside Futures - Where Are Silver Prices Going
VIDEO : The Wall Street Journal - Zulauf says the Federal Reserve will not increase interest rates, and the bond rally will continue.
The Telegraph - Mark Carney warns of liquidity storm as global currency system turns upside down
Acting Man - Mainstream Financial Press Promotes Economic Illiteracy
Contra Corner - Meet Bloomberg’s Latest Idiot: Shobhana Chandra On Why Falling Prices Cause Hungry People To Starve
GoldSeek - COT Gold, Silver and US Dollar Index Report - January 23, 2015
AUDIO : SGT Report - Talking Silver with JM Bullion's James Anderson
Bullion Star - Booming SGE withdrawals In Week 2, 2015: 70 Tonnes
Investor Intel - Low Oil Prices and Demand for Cars to Drive Palladium Prices North
VIDEO : Gordon T Long - FINANCIAL REPRESSION AUTHORITY - w/Charles Biderman
Bullion Baron - John Rubino (Dollar Collapse) Confused on Gold Price
IBTimes - Royal Mint Goes Online; Own Silver, Gold Bars For As Low As $75 VAT-Free
01/23/2015 - Bullion News
The World According to Guyer - Recessions Are Like Medicine And The Fed Isn’t Mary Poppins
Dollar Collapse - This Is What Gold Does In A Currency Crisis, Euro Edition
Daily Reckoning - The Currency Wars’ “Pearl Harbor”
Bullion Star - Will Gold Be Part Of A New International Monetary System?
TECHNICAL ANALYSIS : Market Anthropology - Going Up?
Reuters - Goldman Sachs slashes base metal price forecasts, ups gold
MidasLetter - Gold Price: Bull Run or Bear Trap?
GOLD NANO-PARTICLES : Materials Views - Liquid Gold Nanogels Enhance Radiation Therapy
PIMCO - ECB Review: Blowing on the Embers of a Reflationary Fire
TECHNICAL ANALYSIS : SOLARCYCLES - 3 Exact Dates
VIDEO : CNBC - Professional Thief Reveals How He Steals Silver Out of a House While his Victims Sleep...
NewsMax - Palladium Is Poised to Profit
CoinWeek - The Once and Future King: A (Brief) History of Gold Coins in America
01/22/2015 - Bullion News
guru focus - Tocqueville Investor Letter - Year End 2014
- Over the longer term, we believe that the diminished presence of Western institutions in precious metals markets, and the supplies of synthetic gold in which they specialize, will allow the very bullish supply and demand equation for physical metal to be reflected in the price. Should this shift occur in concert with a diminished role for the US dollar as a reserve currency – a prospect most certainly desired by the BRICs and other developing economies – gold will play an expanded role and the dollar gold price will benefit.
TECHNICAL ANALYSIS : GoldSilverWorlds - Gold: Ride the Bucking Bull to $1340 Next?
AUDIO : Sovereign Man - Powerful investment wisdom from Jim Rickards: The economy is on a knife’s edge
Market Watch - Opinion: How you can cash in on the dollar’s coming decline
The Washington Post - Silver Poised for Bull Market as Economic Woes Boost Demand
Investment U - Something Strange With Precious Metals
CNBC - ECB bond plan won't fix Europe's economy
VIDEO : RT - James Rickards : Canada's Currency War
Economic Policy Journal - THERE IS NO INFLATION: NYC Subway Fare Raised By 10%
VIDEO : Zero Hedge - "Stocks Have Gone Up Due To The Fed" Carl Icahn Warns "It Will Come Home To Roost"
CoinNews - 2015 $5 Gold Eagle Edge Varieties Discovered by NGC
World Gold Council - Turkey: new report highlights gold’s role in supporting the economy and modern society
01/21/2015 - Bullion News
Bullion Vault - Euro QE: Sell Gold on ECB Quanti-Climax?
VIDEO : FXStreet - Technical Analysis : XAUUSD up to a confluence of technical resistance around $1300
The Corner - The Federal Reserve was all set for mid-2015. Is that still true?
VIDEO : CNBC - The Hype is High for Draghi...'What if Draghi becomes 'the boy who cried wolf'...
TECHNICAL ANALYSIS : Kimble Charting - King Dollar and Euro could change trends near here
AUDIO : McAlvany Weekly Commentary - Swiss Franc Shock!
GOLD NANO-PARTICLES : Live Science - 'Nanostar' Particles Make Cancer Cells Light Up
Gold Chat - German Repatriation - Trainspotters Only
The Sovereign Investor - Countries Race to Repatriate Gold, Reveals Concern Over Impeding Financial Crisis
AUDIO : Solidus - Solidus.Center Discusses the Fed with Senior Mises Fellows
CHART : Advisor Perpectives - Two Measures of Inflation and Fed Policy
Economic Policy Journal - Swiss and Chinese Central Banks Cut Deal for Chinese Currency Clearing (A Serious Poke at the Dollar?)
Manchester Evening News - Bullion brand revived by Royal Mint
Scrap Monster - WGC: India must harness gold to boost employment, economy
01/20/2015 - Bullion News
SafeHaven - In America, Government Pays You Interest. In Switzerland, You Pay Government - by Keith Weiner
TECHNICAL ANALYSIS : Nifty Charts - Silver Chart Update
SRSrocco Report - U.S MINT: Unloads Another Million Silver Eagles Over The Holiday Weekend
Economic Policy Journal - The Federal Fiscal Picture as Obama Prepares Do Live the State of the Union Address
Bullion Vault - Yes Really. Audit the Fed - by Ron Paul
TECHNICAL ANALYSIS : Kimble Charting - Gold & Silver much stronger than King Dollar of late
VIDEO : Daily Reckoning - The Fix is In: Why Gold Price Manipulation is Now a Global Effort - by James Rickards
GOLD NANO-PARTICLES : Cosmetics Design Europe - Latex synthesized gold nanoparticles enhance sunscreen SPF - Scientists have found that if gold nanoparticles are synthesized with the latex of a native South American plant, then it can enhance the sun protection factor of sunscreens and offer a potent alternative to titanium dioxide and zinc oxide.
Bloomberg - Honda Warns Against ‘Stupid’ Auto Loans Driving U.S. Sales Gains
Bloomberg - Palladium Is Rarer Than Gold and, Thanks to Cheap Oil, Now Rarer Still
Sunshine Profits - Is Gold Pro-cyclical or Anti-cyclical?
The Deviant Investor - Gold Price Model Says Gold Still Undervalued
Resource Investor - Silver jewelry exports overtake gold in India
Sputnik - "Owning gold in 2015 will again protect and grow wealth as it has done throughout history”
Numismaster - Bullion charges ahead in 2015
01/19/2015 - Bullion News
TECHNICAL ANALYSIS : Sharps Pixley - Gold & Silver; Post SNB-Tsunami
The Telegraph - Hollande backtracks on statement that ECB QE will begin Thursday
CHARTS : Sober Look - Markets pricing in substantial QE operation by the ECB
AUDIO : BullionStar - Germany Repatriated 120 Tonnes Of Gold In 2014
GOLD NANO-PARTICLES : GIZMODO - This Ingestible Microbot Is Powered By Stomach Acid
Economic Policy Journal - Did US Interest Rates Bottom in 2012?
MoneyNews - Jim Rogers on SNB's Franc Move: 'I Explained it Was Coming and Why'
South China Morning Post - China stocks plunge 8pc amid crackdown on brokerages - Crackdown on margin lending sees Shanghai index post biggest single-day drop in six years
The Bullion Desk - Johnson Matthey joins LME PGMs benchmark pricing process
CoinWeek - America’s African-American Numismatic Legacy
KOIN 6 - Silver Coins Found in Abandoned House Given to Charity
Perth Mint Blog - The Wonder of Gold
01/18/2015 - Bullion News
PDF : Gold Standard Insistute - Do You Want True Money or a Debased Dud? - Issue #49 - Excellent Read
CHARTS : McClellan Finanical - The 18% Recession Threshold
TECHNICAL ANALYSIS : Investing - Dollar Outlook: Now It Gets Tricky
MINING - PIMCO : Swiss currency shocker 'dwarfs' end of gold standard
TECHNICAL ANALYSIS : BullionStar - I have a Theory On The Swiss Franc
The National (UAE) - Gold on track for $1,300 following removal of cap on Swiss franc
Zero Hedge - The ECB Will Fail Given The "History Lessons Of US And Japan", Warns Deutsche Bank
Mises Institute - Switzerland Frees the Swiss Franc
Bloomberg - The Swiss Just Made Japan's Job Harder
World Gold Council - Shanghai Gold Exchange and World Gold Council partner to develop the Shanghai Free Trade Zone as a global gold market
GOLD NANO-PARTICLES : redOrbit - How Gold Could Alert You to a Heart Attack
CHART : ValueWalk - Palladium Was the Best Performing Metal in 2014
Economic Policy Journal - Fed Money Printing at Work: First Ever $100 Million Condo Sold in NYC
KRCR - UPS Driver Arrested for Theft of Nearly $200K in Gold/Silver

01/16/2015 - Bullion News
The Sovereign Investor - Swiss Bank’s Surprise Move Reveals Global Currency Crisis
CountingPips - China’s Global Gold Supply “Game of Stones”
BullionStar - China Continues To Drain Global Gold Inventory
TECHNICAL ANALYSIS : The Daily Gold - From Gold Bear to Gold Bull?
VIDEO : The Mess That Greenspan Made - Jim Grant on the World’s Monetary Mandarins
GoldSeek - COT Gold, Silver and US Dollar Index Report - January 16, 2015
Silver Coins Today - American Eagle Silver Coin Sales Dominate
TECHNICAL ANALYSIS : King One Eye - Today's Must-See Gold and Dollar Chart
Profit Confidential - Supply/Demand Equation for Gold Says Prices to Rise More
Wealth Daily - The Fed Will Spend Trillions More
Investment U - Get Ready for the Fed’s Next Big Shocker
Sovereign Man - About that “strong” dollar
The World According to Guyer - The Currency Wars And The International Race To The Bottom
The China Money Report - Swiss Franc rockets…Hedgies taken out to the woodshed and shot
01/15/2015 - Bullion News
Rick Santelli : Will Gold Be the Last Man Standing?
VIDEO : CNBC - Rick Santelli : Will Gold Be the Last Man Standing? - Link to Video Above
The Daily Bell - Should the Fed Stop Paying Interest to Banks on Reserves?
CoinNews - Gold Inches Higher, US Mint Bullion Coin Sales Surge
Market Watch - Gold closes at 4-month high on Swiss shock
Yahoo Finance - 'Like Christmas': Rush to cash in on soaring Swiss franc
The Automatic Earth - The End Of Fed QE Didn’t Start Market Madness, It Ended It
BullionStar - Chinese Lunar Year Gold Buying At Full Steam: 61t Withdrawn From SGE Vaults In 1 Week
CoinWeek - The History of the First Third-Party Coin Grading Service – ANACS
01/14/2015 - Bullion News
Bullion Vault - Inflation Down, Gold Up...?
TECHNICAL ANALYSIS : Smart Money Tracker - Gold and the Gold Bug Chart analysis
AUDIO : McAlvany Weekly Commentary - 2015: A Move to Safe Haven Investments
INFO~GRAPHIC : GoldSilverWorlds - Watch Out When Buying Morgan Dollar Silver Coins
Mish's Blog - Copper Plunges to Price Seen February 2006; Copper vs. Gold
VIDEO : CNBC - Santelli Exchange: Real fundamentals
TECHNICAL ANALYSIS : CEO.CA - Copper Catastrophe
Daily Reckoning - The Death of Copper — And the Rebirth of Silver
AUDIO : FSN - Danielle Park – Credit Bubbles Feel So Much Better Going Up Than Down
TECHNICAL ANALYSIS : SOLARCYCLES - Solar Models
CHARTS : Advisor Perspectives - December Retail Sales Took a Dramatic Plunge
GOLD NANO-PARTICLES : Jewish Journal - Gargle with gold to find oral cancer
csinvesting - Hannibal Lecter on How to Read Ben Graham
University Chronicle - Bitcoin's leading gold bullion dealer, Agora Commodities, has processed a record amount of Bitcoin to gold transactions
01/13/2015 - Bullion News
01/13: TECHNICAL ANALYSIS : ZenTrader - US Dollar Sentiment At Extreme Levels
Zero Hedge - 555 Trillion Reasons Why Central Banks Won't Let Rates Normalize
CoinWeek - The Gold to Silver Ratio – Inside Information or Wishful Thinking
TECHNICAL ANALYSIS : NFTRH - Big Picture Views
Gold Chat - Gold price may be affected by marginal miners not going to company heaven
TECHNICAL ANALYSIS : Kimble Charting - Pattern suggests to Long Silver & Short Doc Copper
MINING - Copper price plummets as commodities drop to 12-year low
The Deviant Investor - Deflation and Central Bank Delusions
CHARTS : Advisor Perspectives - Continuing Proof of Structural Changes in the U.S. Workforce
Sovereign Man - It begins: IRS launches International Data Exchange service
GoldBroker - Alexandre Gautier Answers Questions About the Activities of the Bank of France in the Gold Market
01/12/2015 - Bullion News
CoinNews - 2015 Silver Eagle Bullion Sales Top 2.9M on First Day, Gold Gains
TECHNICAL ANALYSIS : ActionForex - Gold Erodes Long-Term Bearish Trend, $1240 Eyed )
Gold-Eagle - What Really Moves Gold Up Or Down? (And, It’s Not What Most Think)
AUDIO : Bloomberg - Federal Reserve Bank of Atlanta President Dennis Lockhart Talks About the Fed's Views on the Markets, the Fed's Outlook, Includes a Question & Answer Session with Lockart
CEO.CA - Why the Consensus Bearish View on Gold is Misplaced
Acting Man - Gold is Getting Frisky
SoberLook - The ECB exploring QE options
BullionStar - Wikileaks 1976: PBOC Focussed On Gold & SDR’s
Gold Chat - Why asian gold contracts/exchanges haven't been able to crack the London market
Wealth Management - Something’s Brewing In The Gold Market
Casey Research - Facts vs. Fears in 2015 Gold Forecasts
American Free Press - Massive Gold Heists in Ukraine
AUDIO : Peak Prosperity - John Arden: The Science Behind Emotional Resilience
01/11/2015 - Bullion News
CHARTS : LiveTradingNews - The Dow Jones Industrial Average 1885 to 2015
TECHNICAL ANALYSIS : SOLARCYCLES - Triple Confluence Peaks
VIDEO : Kitco - Technical Analysis : What Will 2014's Final Jobs Report Mean For Gold? - Gary Wagner
BullionStar - We Can’t Pretend Forever Gold Is Worth $42.22/Oz
Bullion Vault - Survey Asked : Which Single Factor Will Have the Largest Impact on Gold and Silver prices in 2015
TECHNICAL ANALYSIS : CEO.CA - 4 Reasons the Dollar May Be Putting in a Top
TECHNICAL ANALYSIS : The Sovereign Investor - The Dollar’s Days are Numbered
Contra Corner - Here They Go Again—-Subprime Delinquencies Rising In Autoland
CoinWeek - Ron Drzewucki’s Grading Coins: Lights and Loupes
01/09/2015 - Bullion News
CHARTS : McClellan Financial - Deficits Are Good, Sort Of
Investment U - “Elvis” On Why You Should Invest in Gold
TECHNICAL ANALYSIS : The Daily Gold - Gold Shows Increasing Relative Strength Amid US$ Strength
TECHNICAL ANALYSIS : Smart Money Tracker - The Euro, US Dollar & Gold
CoinNews - America the Beautiful 5 Oz Silver Coin Sales from 2010 to 2014
GOLD NANO-PARTICLES : Cape Brenton Post - Cancer treatment idea wins $50,000 Spark prize
Gold Chat - WGC overstating Turkish Gold Reserves
BullionStar - Chinese Lunar Year Gold Buying Frenzy Started
GoldMoney - Market Report: A steady start for 2015
Wealth Daily - Peak Gold Investing
Global Financial Intelligence - High Mexican Inflation, Gets Banxico Gratification - Google Translation Link
VIDEO : CNBC - Fed's Evans 'patient' on raising rates
TECHNICAL ANALYSIS : Kimble Charting - Gold Miners breakout from bullish falling wedge
Mint News Blog - 2014 US Mint Circulating Coin Production Exceeds 13 Billion
king5 - $1.5 Million Silver Coin Hoard Found in England
01/08/2015 - Bullion News
VIDEO : The Telegraph - Gold price predictions: Will gold rise or fall in 2015?
TECHNICAL ANALYSIS : KingWorldNews - Louise Yamada – 3 Fantastic Long-Term Gold Charts
VIDEO : CNBC - Roach: Fed hasn't learned its lesson
Gold Chat - Chinese gold demand and SGE withdrawals: the role of leasing and inventory changes
BullionStar - The Turkish Gold Standard, Part 1
GOLD NANO-PARTICLES : AZOnano - Major Research Project Receives Grant to Develop Nanoparticle-Based Cancer Treatment
Mises Institute - Multiple Currencies and Gresham’s Law in Zimbabwe
CHART : EconomicPolicyJournal - The Fed Manipulated Boom is On [Unemployment Claims Since the 2008 Crash in One Chart]
VIDEO : Kitco - There's Some Positive News For Gold - Jim Wyckoff
TECHNICAL ANALYSIS : SOLARCYCLES - Macro Updates
TECHNICAL ANALYSIS : StreetTalkLive - 3 Things - Volatility, The Fed and Yield Spreads
Sovereign Man - Man counterfeits $250 million of nearly flawless bills, gets away free
Casey Research - “Paper Gold” and Its Effect on the Gold Price
The Bullion Desk - CME ‘would consider’ Asia-based silver, PGM contracts after gold launch
The Bullion Desk - LME mulling launch of gold and silver futures contracts
01/07/2015 - Bullion News
The Sovereign Investor - Insure and Protect Your Savings Against the Next Global Financial Crisis
Economic Times - Why the Indian Government Should Not See Gold as a Burden
Gold-Eagle - A Tale Of Two Currencies
AUDIO : McAlvany Weekly Commentary - James Grant: The Forgotten Depression
The Bullion Desk - US Mint gold coin sales in first days of Jan surpasses Dec total
Financial Sense - 10 Remarkable Gold and Silver Trends Going Into 2015
TECHNICAL ANALYSIS : The Bullion Desk - Platinum weekly – Upside price pressure rising
TECHNICAL ANALYSIS : Market Anthropology - Why Gold May Finally Be Turning Higher
Market Watch - Opinion: The dollar, on a ‘hurricane path of destruction,’ is set to fall
CoinNews - Annual Perth Mint Gold and Silver Bullion Sales in 2014
Zero Hedge - 2015: Now That The Fed Drove Everyone Into Ruinously Risky Bets...
VIDEO : USA Watchdog - Interview with Silver Guru - David Morgan
The Daily Bell - Again, Bloomberg Questions Whether Historical Shifts Have Doomed Investors' Appreciation of Gold
INFO~GRAPHIC : Visual Capitalist - Death and Taxes 2015: A Visual Guide to Where Your Tax Dollars Go
01/06/2015 - Bullion News
01/06: GoldSilverWorlds - Gold Price In Euro Breaks Out, Pierces €1000
FLASH-BACK : McClellan Finanicial - Gold - Watch the €1000 Level
MoneyBeat (WSJ) - As Silver Slid, Investors Snapped Up American Eagle Coins
TECHNICAL ANALYSIS : The Deviant Investor - Basic Truths and Consequences
Sunshine Profits - Falling Oil Prices and Gold Market
The Corner - Where did all the money go in Greece?
GOLD NANO-PARTICLES : medicalphysicsweb - Nanoparticles Boost Proton Dose
VIDEO : CNBC - Janus' Bill Gross warns risk taking time is past
TECHNICAL ANALYSIS : SOLARCYCLES - Equities Bear Began July 2014
Market Watch - CME Group Announces the Launch of Physically Delivered Gold Kilo Futures
TECHNICAL ANALYSIS : CEO.CA - Gold Déjà vu to Summer 2012
Gold Chat - Being aware of the true nature of unallocated accounts
CHART : Perth Mint Blog - The Perth Mint's Gold & Silver Bullion Sales for December
FOFOA - Happy New Year!
01/05/2015 - Bullion News
American Thinker - Hey, central banker: got a match?
TECHNICAL ANALYSIS : Sunshine Profits - Gold and Miners Refuse to Decline Despite Soaring USD
CoinNews - Annual US Mint Bullion Coin Sales for 2014
Perth Mint Blog - Perth Mint Tackles Milk Spot Issue
Zero Hedge - Scotiabank's Haselmann: "The 30 Year Will Trade With A One Handle In 2015"
Dollar Collapse - Wow, They Really Are Tapering
Casey Research - “Gold Price in Rubles Rises 73% in 2014”
Gold Chat - India gets serious about anti-gold policy
CHARTS : Advisor Perspectives - The Q Ratio and Market Valuation: Monthly Update
Kimble Charting - 87-year streak in S&P 500 could end today!
01/04/2015 - Bullion News
The Corner - Germany: Topsy-turvy world (Part - II)
VIDEO : Investment U - The “Slap in the Face” Award: Why You’re 40% Poorer in 2015
RADIOTHERAPY & NANO-PARTICLES : Planet Tech - Smart Nano-Particles Take Aim at Cancer Cells
TECHNICAL ANALYSIS : GoldtotheMoon - US Dollar index reaches resistance level
Jesse's Cafe' Americain - China Takes 57.6 Tonnes of Gold In the Week Ending December 26th.
CHARTS : GoldBroker - US Mint Coin Sales
Palladium Investing News - The “Slap in the Face” Award: Why You’re 40% Poorer in 2015
Money and Markets - What You Really Need to Know About Gold in 2015...
Monetary Metals - Going All-In On a Weak Argument
The New York Times - The Economics (and Nostalgia) of Dead Malls
NDTV - Treasure Hunter Finds 1 Million Pound Hoard of Anglo Saxon Coins
GOLD NANO-PARTICLES : This is Money - Sprinkling of gold dust should make drugs firm Midatech Pharma a 2015 winner
01/03/2015 - Bullion News
PDF : Wizzen Trading - Technical Analysis : Gold Is Home In The Range
The Corner - Germany: Topsy-turvy world (I)
Zero Hedge - US Debt Soars By $100 Billion On Last Day Of 2014, Hits Record $18.14 Trillion
VIDEO : FXEmpire - Silver forecast for the week of January 5, 2015, Technical Analysis
AZCentral - ID theft, IRA risks, stock scams in 2015
BullionStar - Yearly Shanghai Silver Volume Transcends COMEX Again, SGE Withdrawals Nearly 2,100t
Wealth Daily - 2015 Commodity Investing : 3 Commodities to Own in 2015
TECHNICAL ANALYSIS : Kimble Charting - King Dollar – Entering it’s strongest month of the year...
VIDEO : Federal Reserve Bank of St. Louis - The Reserve's Argument Against a Gold Standard
EconomicPolicyJournal - A Who's Who List of Too-Big-To-Fail Wall Street Banks...
Sovereign Man - Go figure, the poorest place in Europe is run by Communists
01/02/2015 - Bullion News
his outlook for gold in 2015 The Video may take a moment to load
VIDEO : Bloomberg - Will Gold Regain Its Luster in 2015? - Link to Video Above
McClellan Financial - Euro Is Ripe For An Upturn
TECHNICAL ANALYSIS : ActionForex - XAU/USD Capped by Dense Supply Aarea at $1,190
TECHNICAL ANALYSIS : SOLARCYCLES - Yearly More Indicator Updates
BullionStar - Yearly Shanghai Silver Volume Transcends COMEX Again, SGE Withdrawals Nearly 2,100t
SRSrocco Report - GLOBAL SILVER DEMAND GROWTH: Coin & Bar Take First Place By Wide Margin
RCP - A Year of Anniversaries - by Thomas Sowell
Mint News Blog - 2015 Proof American Silver Eagle
01/01/2015 - Bullion News
HAPPY NEW YEAR!
Free Shipping on Orders $199+
Other pages, on this Guide, that you
may like...
|
|

|


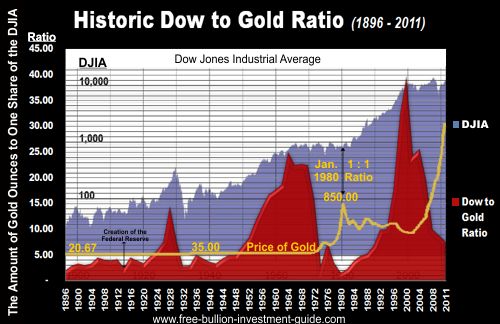


For Bullion Market News...
Notice:
The charts, commentary, and information on the Free-Bullion-Investment-Guide.com are in no way an endorsement of how you should invest or divest.
|
Support this Guide & Paypal Thank You for Your Support |
|
|
 | |||||

Recent Articles
-
Newsletter of the Free Bullion Investment Guide - February 2026
Feb 07, 26 04:05 PM
 The February 2026 newsletter of the Free Bullion Investment Guide provides the latest updates, fundamental and technical gold and silver market analysis, the best articles from last month, and a list…
 -
Newsletter of the Free Bullion Investment Guide - December 2025
Dec 07, 25 02:24 PM
 The December 2025 newsletter of the Free Bullion Investment Guide provides the latest updates, fundamental and technical gold and silver market analysis, the best articles from last month, and a list…
 -
Newsletter of the Free Bullion Investment Guide - November 2025
Nov 08, 25 01:52 PM
 The November 2025 newsletter of the Free Bullion Investment Guide provides the latest updates, fundamental and technical gold and silver market analysis, the best articles from last month, and a list…
 -
Premium Bullion - 1 oz Silver Majestic Polar Bear Coin
May 18, 25 04:17 PM
 The Premium Bullion - 1oz Silver Majestic Polar Bear coins are specially made for collectors and investors alike; they are made of 99.99% pure silver and have a limited mintage; it is in an assay card…
 -
Latest Update (3/14/25) from the Free Bullion Investment Guide
Mar 14, 25 11:23 PM
Free Bullion Investment Guide's Latest Updates: Mexican Gold and Silver Libertad - 2024 Mintage Figures & more...

18W LED Security Light (Dusk to Dawn & Motion Sensor) - $32.99
from:
 LED Lighting


This website is best viewed on a desktop computer.
Keep this Guide Online
& Paypal
Thank You for
Your Support
with Feedly
Search the Guide
| search engine by freefind | advanced |
Premium Canadian Bullion

Give a lasting gift of the iconic Silver Maple Leaf bullion coin [More]
Free Shipping on Orders over $100 (CDN/USA)
or
From the U.K. Royal Mint


Daily
Newsletter
Updated Mintages for
American Gold Buffalo
American Gold Eagle
American Silver Eagle

2024 & 2025
Jerusalem of Gold Bullion
Coin photos
(bottom of page)
 Obverse side")
 Obverse side")
Mintages
for
2024
Gold & Silver Mexican Libertad
|
Gold Libertads |


Chinese Gold Coin Group Co.
& Chinese Bullion


Help Us Expand our Audience by forwarding our link
www.free-bullion-investment-guide.com.
Thank You!
Last Month's

In No Particular Order
January 2026
All Articles were Originally Posted on the Homepage


Click Ad to Request a Free Appraisal Kit
ExpressGoldCash
Customer Reviews 4.9 stars


Give a lasting gift of the iconic Silver Maple Leaf bullion coin [More]
Free Shipping on Orders over $100 (CDN/USA)
