Yellen's Bluff -
The Oil Industry
Part I
The Fed has given the Oil Industry a Wild Ride and it May Cause 'Yellen's Bluff' to Peak.
Originally Posted on 3/27/2017 @6:15pm
Last Edited & Updated 3/28/2017 @8:29pm
By Steven Warrenfeltz
Subscribe to this Weekly Blog post
My uncle Paul was an investor and a WWII B-24 navigator; he gave his sons one of the best pieces of advice that everyone should use in life and investing: "Keep Your Eyes on the Horizon."
Intro:
Two weeks ago, in the blog post ‘Is Janet Yellen Bluffing?’, it ended with what I call ‘Yellen’s Bluff.’
Every Fed Chairman has built one; some more than others.
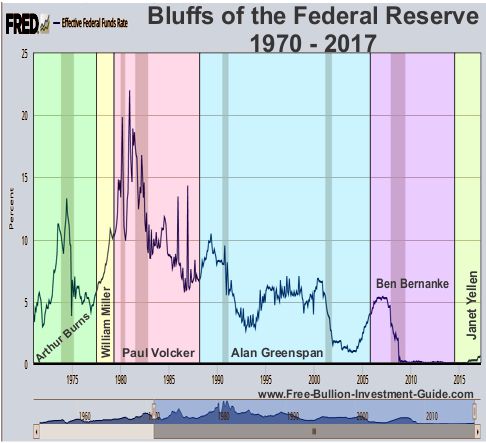
The most boneheaded one has to be Ben Bernanke’s Bluff (interest rate hikes).
Why?
Because Ben Bernanke kept increasing the Federal Funds rate after Greenspan had left office and seemed to have slowed inflation’s rise.
The Federal Funds Rate is the interest rate at which banks and other banking institutions lend money to each other, usually on an overnight basis and it is a benchmark for other interest rates; see here.
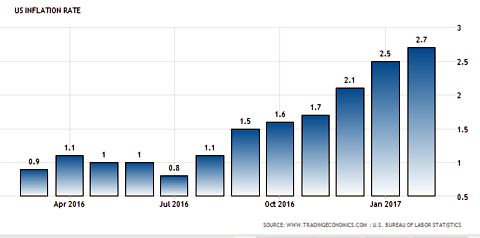
Yellen’s Bluff will be the smallest in the group, how high it will go is anyone’s guess, but I doubt that it will come close to the current rate of year over year inflation - 2.7%.
There is simply too much debt in the system for it to come close to this level.
That is what this series on ‘Yellen’s Bluff’ is about, and what could be the catalysts for ‘Yellen’s Bluff’ to peak.
This first entry will be on the Oil Industry.
The Oil Industry - A Few Facts
First, here are a few facts to know about the Oil Industry
|
|
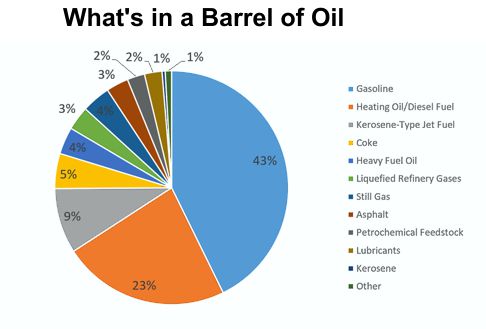
The other thing to know is that we live in an oil-based economy and when the price of oil goes up so does everything else.
Source: Energy Education - What's in a Barrel of Oil
'Fed' Moves: 2004 - 2014
How the Federal Reserve's actions helped the
Oil Industry and Hurt Everyone Else
Before we get into what today’s problems are with the oil industry, we need to look into the past and find out how it got here.
We often hear that the 2008 recession was caused by the fall of the housing market, which it was, but one of the underlying factors that helped caused the housing market to fall was the squeeze placed on the American Consumer due to higher interest rates.
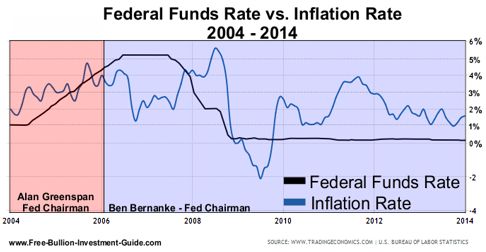
In 2004, Alan Greenspan increased the Federal Funds to slow inflation, and by looking at the chart below, he did before he left office in January of 2006.
However, after Bernanke assumed the Federal Chairmanship in February of 2006, he continued to raise interest rates, which doesn’t make a whole lot of sense.
But, in doing so he kept the pressure up on the American consumer by driving the prime rate over 8%, this raised the interest rates on Credit Cards, Mortgages, Car Loans, Student Loans, etc.
For those that argue;
"Bernanke was trying to tame the housing market."
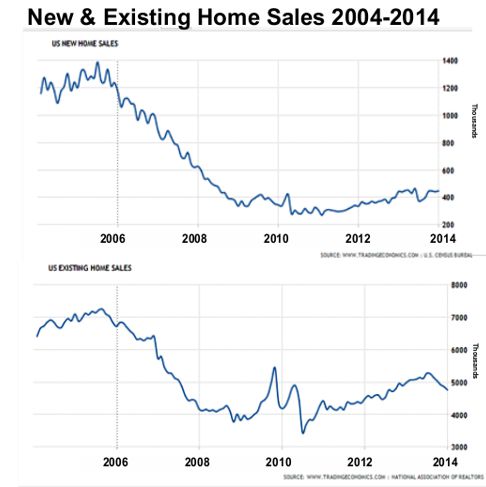
The answer can be seen in the two charts below; After 2005, the housing market was slowing down.
Home sales started to drop in mid-2005, but the prices didn't peak until 2008 with inflation and oil.
If you compare the 'Federal Funds Rate/Inflation Rate chart (above) with the 'Home Sales' charts (below), you can't help but wonder what would have happened had Bernanke left rates a 4.25%, the outcome would most likely have been different.
Click these links for new home sales source & and existing home sales source.
In mid-2007, when inflation started to build again, Bernanke dropped the Federal Funds rate, helping the inflation rate to increase.
During this same time, the oil industry was going through a boom, supply was low - see here, while demand and inflation were elevated, and oil company stocks were reaching new heights.
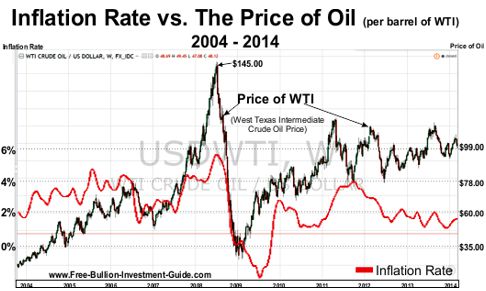
As inflation peaked, the price of oil rose to $145 a barrel; hurting every American’s wallet.
Gas, Diesel Fuel, Jet Fuel and Home Heating Oil were all rising well above what most American consumers were used to, making the price to pay to get to work or heat their home a lot harder to do.
In addition, every product that is moved by a Tractor Trailer became inflated because the trucks that brought the goods to the store were paying more than $5.00 a gallon for diesel fuel.
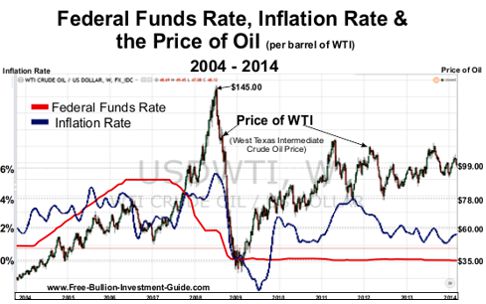
Ben Bernanke kept the Federal Funds rate elevated when he should have left it alone or lowered it, and then when inflation started to rise, he lowered it; in so doing, he created a recipe for disaster for the American economy.
Oil Price - After 2008
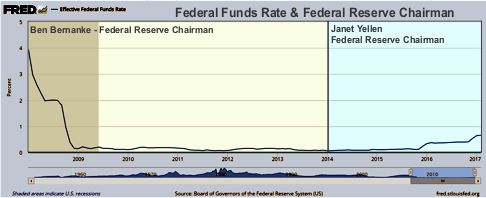
After the markets crashed, the Fed dropped interest rates close to 0%, which created a market where the US Dollar was low and so were interest rates, creating a perfect lending scenario for any company.
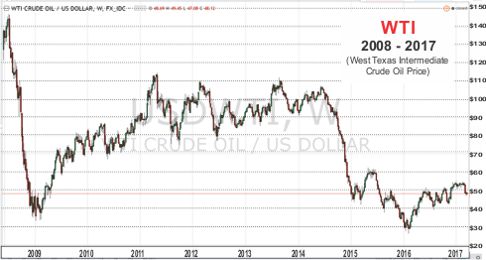
After 2009, oil prices were back on the rise, and by 2011, the price of oil was back above $90.00 per barrel.
This was the same time the Shale Oil boom started to gain traction because drilling for shale oil, costs more than other forms of oil drilling.
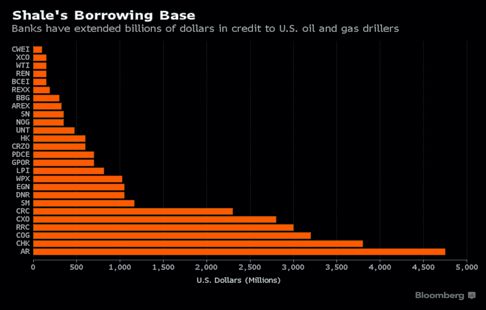
The Fed held interest rates low to encourage business lending, and oil companies large and small found this to be a perfect opportunity to opened credit lines to help them finance their new prospects.
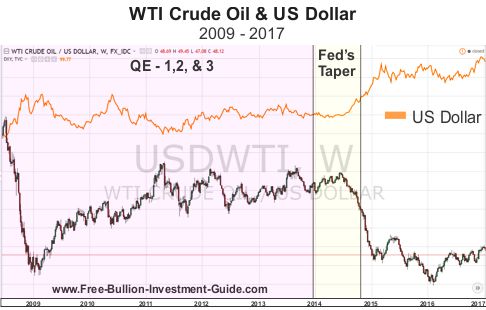
Then in December 2013, the Fed started to reduce QE3’s bond
purchases, Ben Bernanke called it ‘Tapering.’
‘Tapering’ lasted until October of 2014; this, in turn, helped the dollar climb in price, which caused the price of Oil to collapse.
Charts provided courtesy of TradingView.com
After the Collapse of Oil Prices
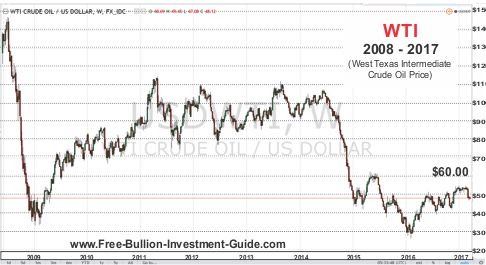
Oil companies have been in trouble since oil prices started to tumble.
For most oil companies, oil needs to be above $50 a barrel for their business to be economically viable; companies that drill for shale oil, need oil to be at least $55 to $60 a barrel.
From January 2015 to February 20th, 2017, there have been 119 bankruptcies among the oil producers, totaling $79.7 billion in cumulative secured and unsecured debt.
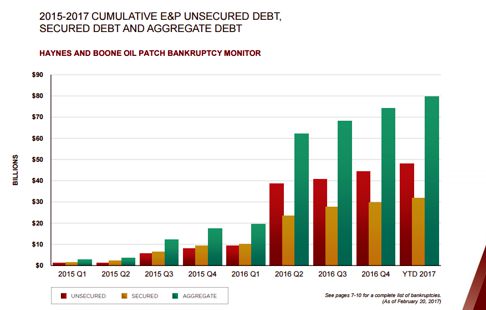
See the full Haynes & Booth report here - Source Haynes & Booth: http://www.haynesboone.com/~/media/files/energy_bankruptcy_reports/2017/2017_oil_patch_monitor_20170220.ashx
What's Happening Now and
What to Keep an Eye on
Lines of Credit - Bank Reassessments
As of this date, March 27, 2017, WTI is trading around $47 a barrel, so you can pretty much expect that any oil company that is having a tough time with cash flow is taking money out of their credit line(s).
This also happens to be the time when banks are reassessing these lines of credit.
If the price of oil stays below $50.00 a barrel, many of these lines of credit will be reassessed.
For those oil companies who have their credit lines reassessed and reduced, they will need to make up the difference within a certain time period or the bank will close the line of credit, which will shut down the company's operations.
OPEC
OPEC – the financial press and oil industry participants are keeping an eye on OPEC, they are in the middle of deciding whether or not they will extend production cuts.
If they decide to extend production cuts for another 6-months, oil may climb back up to $60 a barrel, however, if OPEC doesn’t cut production then prices could fall to $40 a barrel of oil or lower.
A decision isn't expected until May.
Inflation
Inflation is a double edged sword for the oil industry.
When supply is low, inflation helps increase the price of oil.
But when supply is high, inflation doesn't help the price of oil and it makes business more costly to run.
Some have said that technology advancements have lowered the costs of drilling for shale oil, however this article offers a better answer for the lower costs; a depressed market.
US Oil Supply
In the United States, the oil rig count is on the rise, for some it doesn't make a whole lot of sense to do this with oil prices down.
But others see that oil companies need cash and the only way for an oil producer to make money is to drill and sell oil.
As noted in the article referenced above Oil Price - Tech Miracle In U.S. Shale Is A Media Myth, oil rigs cost less than they used to, so it makes sense to drill when it is more cost effective.
But, OPEC is paying attention, and it could backfire on drillers if OPEC doesn't decide to keep their cuts.
Hedging
On March 10th, Tom McClellan of McClellan Financial posted the following article about the massive short position in the oil market: Huge Imbalance in Crude Oil Positions
A company hedges if they think the price of an asset, in this case oil, is going to drop to protect themselves from falling prices.
The following article offers some more insight the most recent hedging by the oil industry and what you can expect from the oil industry, this year.
The Fed
The dollar fell after the latest Federal Reserve rate hike because traders expected more hawkish rhetoric out of the Fed’s Statement and Janet Yellen.
Every participant of the Federal Open Market Committee has stated that their policies are data dependent.
Since the Fed started its experiment with QE (quantitative easing), it has stated that they would raise the Federal Funds Rate when Inflation consistently stayed above 2% and unemployment consistently stayed below 5%.
Inflation is 2.7%
Unemployment is 4.7%
If the Federal Reserve moves more aggressively in the future with rate hikes, it will add to the downward pressure on oil's price, and it could bring about the peak to 'Yellen’s Bluff.'
Thank You for Your Time!
www.free-bullion-investment-guide.com
|
Support this Guide & Paypal Thank You for Your Support |
|
|
 | |||||
This website is best viewed on a desktop computer.
Keep this Guide Online
& Paypal
Thank You for
Your Support
with Feedly
Search the Guide
| search engine by freefind | advanced |
Premium Canadian Bullion
Give a lasting gift of the iconic Silver Maple Leaf bullion coin [More]
Free Shipping on Orders over $100 (CDN/USA)
or
From the U.K. Royal Mint

Daily
Newsletter
Updated Mintages for
American Gold Buffalo
American Gold Eagle
American Silver Eagle
2024 & 2025
Jerusalem of Gold Bullion
Coin photos
(bottom of page)
Mintages
for
2024
Gold & Silver Mexican Libertad
|
Gold Libertads |
Chinese Gold Coin Group Co.
& Chinese Bullion
Help Us Expand our Audience by forwarding our link
www.free-bullion-investment-guide.com.
Thank You!
Last Month's

In No Particular Order
January 2026
All Articles were Originally Posted on the Homepage


