
What's Going On?
Market OverView
'Analysis' of the Markets latest movements,
and the U.S. Dollar, Silver, and Gold
Originally Posted on 10/14/2018 @ 4:34 pm EDT
Last Edited / Updated on 10/15/2018 @ 6:40 am EDT
by Steven Warrenfeltz
Subscribe to this Blog

Hello,
Thank you for visiting the Free-Bullion-Investment-Guide, every visit you make is greatly appreciated.
Before we get to this Review & Outlook, below are some of the Best Bullion Market-Related News articles that were taken from this guide's home page, over the last several weeks.

It Took Only 10 Minutes to Send Gold and Silver Prices Soaring - Bloomberg
Is cheap debt creating a CRE (Commercial Real Estate) bubble? - The Real Deal
I Was Asked: Why Did All this Money-Printing Not Trigger Massive Inflation? - Wolf Street
U.S. Mint Silver Eagle Sales Spike By Another 1 Million At End Of September - SRSrocco Report
The Bigotry of the Literati - Mises Institute
In FY 2018: Debt Up $1,271,158,167,127; Feds Borrowed $8,172 Per Every American With a Job - cnsnews
5 Charts That Show Why Gold Belongs in Your Portfolio Now - U.S. Global Investors
Margin Debt and the Market - Advisor Perspectives
Scarcity? Buy-Backs vs. Gold - Bullion Vault
Gold Is the Most Hated It's Been in 17 Years - Daily Wealth
Best of the Week for
Gold NanoParticle Cancer Research
Nanoplatform developed with 3 molecular imaging modalities may improve cancer diagnosis - Health Imaging
Detecting Cancer With Gold - University of Central Florida
Nanostar Applications in Biomedicine - News Medical

Normally, you'd find a review and outlook here for the US dollar, silver, and gold, but with the unknowns in the market, I thought I'd write an overview that will last till the U.S. Congressional election has passed.
About two years ago, I wrote a blog post titled: Trump's QE, it was mostly about how the stock market was spiking on Trump's words and promises, not on actions and it was about how the market could be peaking on just Trump's words.
However, two years later, President Trump has come through on his promises and expanded the economy by lowering corporate taxes and reducing regulations.
There are still issues with the economy, most notably: spending and
debt, but I'm only reflecting on the what I wrote in Trump's QE, not dissecting the
good and the bad in the market.
But, despite the good signs in the economy, in the news over the last few days, there's been a lot of talk about the sell-off in the stock markets.
The stock market’s nightmare may be far from over - Market Watch
The arguments made in the articles above and others like them about a market down-turn don't hold much water, and here's why.
First; Interest Rates:
Two weeks ago, the Federal Reserve raised interest rates by a quarter of a percent, and if they raise interest rates again it won't come till mid-December, so it's foolish to say that the market is selling off now on the possibility of another rate hike, that's 2 months away.
Second; Inverted Yield Curve:
Those in the financial news outlets are always talking about an 'Inverted Yield Curve' (definition: here) and how it's a good barometer for the next market crash.
Here's a snapshot of the current yield curve, does it look inverted to you?

Let me be clear, I'm not saying it won't become inverted, I'm also not saying that a inverted curve isn't one of many warning signs of a market top, I'm just showing you that it isn't inverted now.
Plus, in many other market tops, the yield curve doesn't just invert once and then the market crashes, it inverts repeatedly and often before the market tops out.
The snapshot below of the 'inverted' yield curve is from November 2006, nearly two years before the market crash of 2008.

Third; Technical Chart Damage:
Let me show you some positive trend-lines in the DJIA - Dow Jones Industrial Avg, the rising trend-line in the first chart below dates back to the lows of the financial crisis lows in March of 2009.
Note: these same trend-lines can be drawn on the S&P 500, I simply decided to use the Dow Jones Industrial Avg. for these charts.

Clearly, we aren't anywhere near breaking this line in the future, and the DJIA would have to fall another 2000 points to come close to the next rising trend-line, in the chart below, that dates back to February of 2016.

However, last Thursday, the DJIA dropped down to the next rising trend-line (below) that is directly correlated to President Trump.
This rising trend-line started on the day President Trump was elected into office, on Nov. 8th, 2016.
The pullback in the DowJones Industrial Avg., and other markets, on Thursday, fell to that trend-line and closed the day of trading on it, then, the next day, it bounced back above it.

Here's a closer view of Friday's movement on the DJIA and its interaction with the 2-year Rising Trend-line that correlates to President Trump's election.
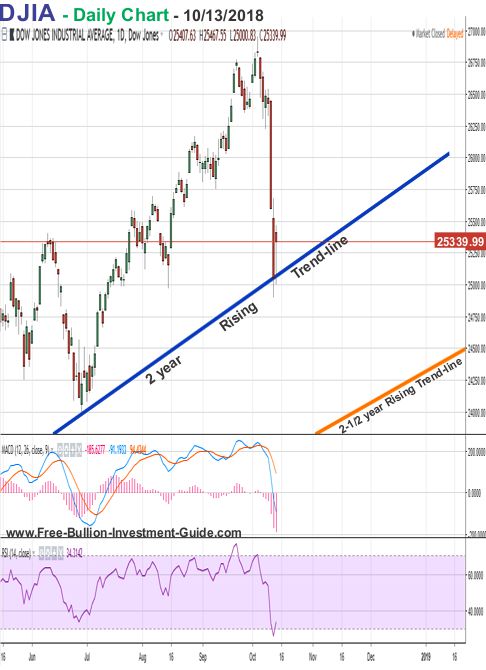
Clearly, the rising trend-lines for the DJIA have not been compromised, however, the market could still fall below the trend-line it just bounced off of and test the other rising trend-line that dates back to February of 2016.
Time will tell if that happens.
But, if interest rates, yield curves, and technical factors in the broad market had nothing to do with the recent sell-off; What did cause it?
First of all, the stock markets had risen in price since July without a substantial pullback or consolidation, so one was bound to happen.
The other reason is 'Uncertainty' in the markets about the U.S. Congressional mid-term elections.
In case you've been living under a rock since President Trump's election, just about every democrat absolutely hates President Trump, especially those in Congress.
In addition, if the Democrats in Congress win the majority in the House of Representatives on election day 2018 (Nov. 6th) all we'll hear after that day is who the democrats are going to investigate and when they are going to try to start the impeachment process.
The Democrats hatred for President Trump has made them blind to the positives in the economy.
If they win the majority in the House of Representatives, it will likely create a lot more Uncertainty in the markets and this will most likely cause more sell-offs and a testing of the 2009 rising trend-line.
So, until the election, we will likely see more of this kind of 'Uncertainty' in the markets.
Review & Outlook
|
All the charts on this blog are Daily Charts unless noted otherwise.
US DOLLAR
In Review
In the last outlook for the U.S. Dollar, the following commentary and outlook was posted:
In the U.S. Dollar's outlook chart below, a positive 'Falling Wedge' pattern has formed.
As seen here, the market is overwhelmingly expecting the Federal Reserve to raise interest rates another quarter of a percent (.25%) at its next meeting, later this week on Sept 25-26.
So, if the Federal Reserve raises rates, as it is expected to do, the positive 'Falling Wedge' pattern should be confirmed sometime in the near future.

U.S. Dollar - In Review - continued
In the U.S. Dollar chart below, the dollar did what was stated in the last blog post: the positive 'Falling Wedge' pattern should be confirmed sometime in the near future.
U.S. Dollar - Outlook
The outlook for the dollar mostly depends on fundamentals and which way the election swings in three weeks.
Technical analysis is virtually useless until after the election.
If the Democrats take control of the House of Representatives it will likely cause the dollar to fall because economic expansion could be jeopardized.
However, if they don't win the 'House,' then we can expect to see the dollar rise higher.
Time will tell.
Over the next three weeks, it's likely we'll see the dollar move sideways as it skirts along the $95.00 Support / Resistance level.

Charts provided courtesy of TradingView.com
U.S. Dollar's Price Resistance and Support Levels
U.S. Dollar's Resistance Levels
$96.00
U.S. Dollar's Support Levels
$94.00
$93.00
For Bitcoin (BTC/USD) and Stellar (XLM/USD) Analysis

SILVER
In Review
In the last blog post title; 'Gold and Silver are Forked,' the outlook below was posted for silver.
As you can see in the 1st Outlook chart below, silver has continued to fall in price, however, it also found a consolidation price level around the $14.20.
Below, is the first view of the 'Andrew's Pitchfork,' the 2nd Outlook chart (below) offers more information about this technical trading pattern.

In the 2nd silver outlook chart, below, you can get a better view of the Andrew's Pitchfork.
Even though there are some technical factors that are involved in finding them, as mentioned in the intro in 'practical terms' an Andrew's Pitchfork is simply a glorified channel.
The green area of the pitchfork is called the median, the lower blue shaded trend-line is support and the upper blue shaded trend-line is resistance.
Furthermore, much like a channel, if the price of silver breaks below the support level, it will be a very bad sign for silver's future price, however, if/when it breaks above the upper trend-line, it will be the first sign that it has found a bottom.
See a full explanation of a Andrew's Pitchfork here.
For silver's outlook;
The market is waiting to see what the Federal Reserve will do by the end of the week, I, like those in the market expect 'the Fed' to raise rates again and if that happens we should see silver test the nearly three-year-old support level of $13.60. (see chart above)

Silver - Review - continued
By looking at the 'review and outlook' chart below, the price of silver didn't fall in price and test the $13.60 level, as was stated in the last blog post.
Instead, it rose in price.
Silver - Outlook
Silver's currently bouncing between $15.00 and $14.00, its trajectory is moving higher, but it is still trading inside the Pitchfork, which isn't good.
For silver's outlook, more of the same is expected until after the election sideways movement with an upward slant.

Charts provided courtesy of TradingView.com
Silver's Price Resistance &
Support Levels
Silver's Resistance Levels
$15.60
$15.00
Silver's Support Levels
$13.60
For Bitcoin (BTC/USD) and Stellar (XLM/USD) Analysis
GOLD
In Review
The following chart and commentary was posted in gold's last outlook.
In gold's outlook chart below, you can get a better view of how gold's price has consolidated at the $1,195 resistance/support price level.
In addition, just like silver, if the price of gold falls below the bottom blue shaded trend-line, it will be a very bad sign for gold's future price.
However, if/when it breaks above the upper blue shaded trend-line, then that will be the first sign that it is forming a bottom.
For now, the market is expecting the Federal Reserve to raise interest rates by 25 basis points (.25%), and if it does so, the price of gold is expected to continue to trade inside the Andrew's Pitchfork and move lower.

Gold - Review - continued
Like silver, gold didn't move down after the Federal Reserve raised interest rates, instead if you compare outlook chart (above) with the review and outlook chart below, the price of gold moved along the $1195 support and resistance level before it broke above the pitchfork, near the end of last week.
Gold - Outlook
Gold's break above the Pitchfork is a good sign, and it could be a sign that a bottom has been found, but, I'm not convinced yet until after the U.S. Congressional election.
For gold's outlook, I've tried to find a technical pattern in gold's chart, but there aren't any, fundamentals will drive gold's move over the next three weeks, which will likely move like silver; sideways with an upward slant.
Overall, depending on how the polls look, as the election draws near, Gold will move depending on how each political party looks.
If the Democrats take control of the House of Representatives, then we'll likely see gold (and silver) spike, but if the Republicans hold, we'll likely see more of the same out of gold.
Time will tell.

Charts provided courtesy of TradingView.com
Gold's Price Resistance and
Support Levels
Gold's Resistance Levels
$1225.00
Gold's Support Levels
$1195.00
$1120.00
$1045.00
Thank You for Your Time.
Take Care & God Bless,
Steve
'Click Here' see all of the prior Blog posts,
Thank You for Your Time!
|
Investment/Information Disclaimer: All content provided by the Free-Bullion-Investment-Guide.com is for informational purposes only. The comments on this blog should not be construed in any manner whatsoever as recommendations to buy or sell any asset(s) or any other financial instrument at any time. The Free-Bullion-Investment-Guide.com is not liable for any losses, injuries, or damages from the display or use of this information. These terms and conditions of use are subject to change at anytime and without notice. |
Return from this Guide's Latest Blog Post
|
Support this Guide & Paypal Thank You for Your Support |
|
|
 | |||||

Recent Articles
-
Newsletter of the Free Bullion Investment Guide - February 2026
Feb 07, 26 04:05 PM
 The February 2026 newsletter of the Free Bullion Investment Guide provides the latest updates, fundamental and technical gold and silver market analysis, the best articles from last month, and a list…
 -
Newsletter of the Free Bullion Investment Guide - December 2025
Dec 07, 25 02:24 PM
 The December 2025 newsletter of the Free Bullion Investment Guide provides the latest updates, fundamental and technical gold and silver market analysis, the best articles from last month, and a list…
 -
Newsletter of the Free Bullion Investment Guide - November 2025
Nov 08, 25 01:52 PM
 The November 2025 newsletter of the Free Bullion Investment Guide provides the latest updates, fundamental and technical gold and silver market analysis, the best articles from last month, and a list…
 -
Premium Bullion - 1 oz Silver Majestic Polar Bear Coin
May 18, 25 04:17 PM
 The Premium Bullion - 1oz Silver Majestic Polar Bear coins are specially made for collectors and investors alike; they are made of 99.99% pure silver and have a limited mintage; it is in an assay card…
 -
Latest Update (3/14/25) from the Free Bullion Investment Guide
Mar 14, 25 11:23 PM
Free Bullion Investment Guide's Latest Updates: Mexican Gold and Silver Libertad - 2024 Mintage Figures & more...

18W LED Security Light (Dusk to Dawn & Motion Sensor) - $32.99
from:
 LED Lighting

")
This website is best viewed on a desktop computer.
Keep this Guide Online
& Paypal
Thank You for
Your Support
with Feedly
Search the Guide
| search engine by freefind | advanced |
Premium Canadian Bullion

Give a lasting gift of the iconic Silver Maple Leaf bullion coin [More]
Free Shipping on Orders over $100 (CDN/USA)
or
From the U.K. Royal Mint


Daily
Newsletter
Updated Mintages for
American Gold Buffalo
American Gold Eagle
American Silver Eagle

2024 & 2025
Jerusalem of Gold Bullion
Coin photos
(bottom of page)
 Obverse side")
 Obverse side")
Mintages
for
2024
Gold & Silver Mexican Libertad
|
Gold Libertads |


Chinese Gold Coin Group Co.
& Chinese Bullion


Help Us Expand our Audience by forwarding our link
www.free-bullion-investment-guide.com.
Thank You!
Last Month's

In No Particular Order
January 2026
All Articles were Originally Posted on the Homepage