Trump's QE
Trump’s QE is not
like the Quantitative Easings of the past, but
it’s having the same effect on today’s
markets.
Originally Posted on 11/27/2016 @3:38pm
Last Edited: on 11/28/2016 @11:46am
by Steven Warrenfeltz
Don’t let the title mislead; This post is about economics, not politics.
Trump’s QE is not like the Quantitative Easings of the past, but it’s having the same effect on today’s markets.
Quantitative Easing came from former Federal Reserve Chairman Ben Bernanke, his last form of QE, dubbed QE3 directed the Federal Reserve to buy eighty-five billion dollars in bonds of mortgage-backed securities - every month.
QE or Quantitative Easing created a new mindset for market traders and the financial media, one that gave them the impression that the 'Free Market' can be managed by government; ("it can't").
Trump’s QE is based on words and expectations, the words have come from Trump himself, and those who will be in his administration and the expectations are coming from market traders and financial media.
For Trump’s part, he’s made promises to increase military spending, cut corporate & personal taxes, reduce regulations, expand oil exploration and pipelines, and renegotiate trade deals.
We haven’t heard much from the new administration, except what Steve Bannon, Trump’s New Chief Strategist, has stated in this post-election interview with the Hollywood Reporter:
“I'm the guy pushing a trillion-dollar infrastructure plan. With negative interest rates throughout the world, it's the greatest opportunity to rebuild everything. Shipyards, ironworks, get them all jacked up. We're just going to throw it up against the wall and see if it sticks.”
Source: Hollywood Reporter - Ringside With Steve Bannon at Trump Tower as the President-Elect's Strategist Plots "An Entirely New Political Movement" (Exclusive)
These words have given market traders reasons to expect that the future will be filled with growth and inflation.
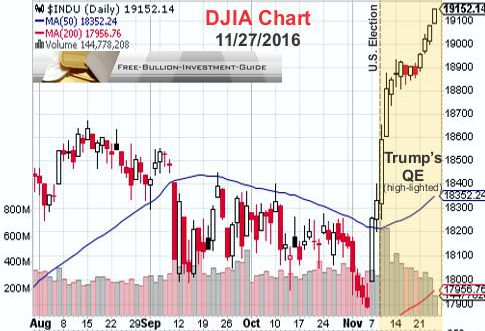
Quarterly Charts provided courtesy of StockCharts.com
As of Nov. 27th, 2016, the official U.S. Bureau of Labor & Statistics (BLS) inflation rate is 1.6%.
But, since the election, the reason for the bond sell off is due to the Market's "Expectation" of Higher Inflation.
Bonds sell off in a higher inflationary environment because if the interest rate on a bond is lower than the rate of inflation, the bond is not worth holding.
The result is; bonds lose value causing interest rates to rise.
This also explains why gold and silver prices rose in April & May of 2016 during the Federal Reserve’s talk of Negative Interest Rates. These actions tell investors; "It’s better to hold something with no interest rate (gold) than an asset with a negative interest rate (bonds)."
Also, Trump’s QE has given the market reason to expect higher growth in the future which has caused the markets to sell safer assets like bonds, gold, and silver for higher risk assets, namely stocks.
Normally, Higher Inflation or just the Expectations of Higher Inflation should give gold and silver a boost.
But, the precious metals are down due to everyone's expectation of the Federal Reserve to raise interest rates on December 14th.
The New Norm?
There are a lot of issue’s behind Trump’s QE, and they all have to do with the mind's of market traders.
First off the bat, while I’ve been writing this blog post I’ve been listening to Main Stream Financial Radio, most it which I don’t agree with, but in consideration of the markets, I like to know what all sides think.
In addition, mainstream financial news often mixes political leanings with financial facts, but I've listened to these stations enough to learn how to get the facts through the B.S.
My point here is that from what I’ve heard about market traders in the news reports is that they see this latest market rise as the New Norm; my interpretation – its B.S.
Here's Why:
First, the chart below shows the Dow Jones Industrial Average (DJIA) rising in Trump’s QE market with trading volumes falling, and its indicator's (RSI & MACD) trading in overbought territory.
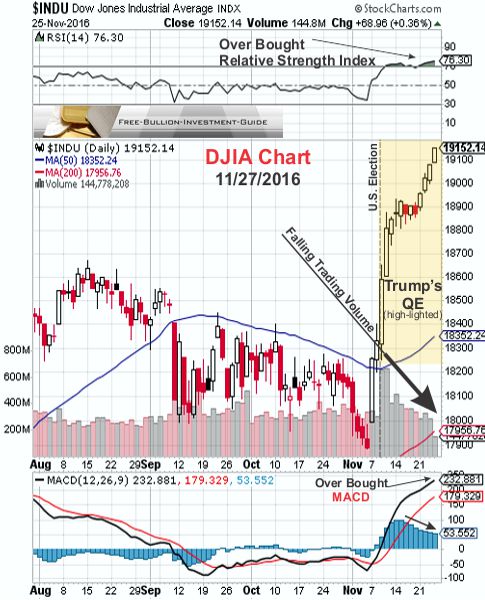
The decrease in market volume can be partially explained in this tweet by Jesse Felder titled: ‘Stock buybacks fall to the lowest level in nearly 3 years’ – click here to see the tweet.
The other reason is based on a speculative hunch of mine:
I think a possible reason for the decrease in market volume is due to some professional market traders, those who make big trades with more frequency, decided to take an early end of the year vacation, after the election.
Or perhaps the HFT computers have been switched off until better stock valuations materialize.
Either way, I think it is possible that these professional traders have been replaced by new, euphoric retail investors who have flooded the markets selling all or part of their 401K’s and mutual funds in anticipation of better days ahead.
The problem is many new investors are unaware of the negative issues that have been building up in the markets to this date; i.e.: near full employment, a Fed that is antsy to raise interest rates and a stock market that has gained value on credit, debt, and stock buybacks, not growth and earnings.
Tobin's Q-Ratio
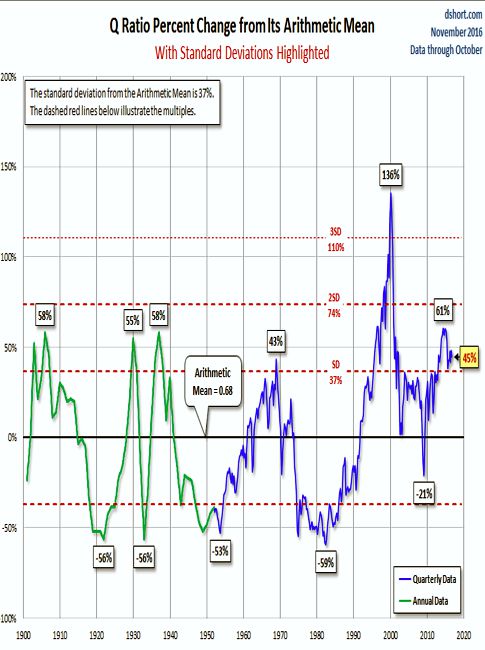
Another factor that explains why this latest rise in the markets should not be considered the 'New Norm' can be seen in the Q-Ratio Chart below.
The Q-Ratio is a simple concept, but difficult to calculate. Defined - the 'Q-Ratio' is the total price of the market divided by the replacement cost of all its companies. (Source: Advisor Perspectives)
chart provided courtesy of advisor perspectives by Jill Mislinski.
The first thing to recognize when you look at the chart above is that it was last calculated on November 1st, 2016, so the latest run up in stocks valuations, are not shown.
In addition, the blogger of ‘Variable Opposition’ wrote about this Q-Chart chart on Friday (11/25/2016); His comments reveal what the Financial News Media and Traders of this Stock Market do not understand:
“Ms. Mislinski's calculations show that the Q Ratio currently sits at 45 percent above the mean and is now in the vicinity of the range of the historical peaks, excluding the Tech bubble peak.
I can recall during the tech boom when "experts" were telling us that the traditional metrics used to evaluate companies like earnings per share etcetera were no longer valid. Obviously, that was an incorrect analysis with the Q Ratio clearly showing that valuations returned to (and below) the mean. With the S&P 500 and Dow Jones flirting with record highs on an economy that is definitely not performing on all cylinders and the Fed flirting with monetary policy "adjustments", the current Q Ratio suggests that we are experiencing stock market valuations that are not sustainable. History has repeatedly shown that the Q Ratio always returns to the mean. After all, that's why it's called "the mean.”
Source: Variable Opposition - What is Tobin's Q Telling About Stock Market Valuations?
Conclusion
In conclusion, whoever is investing in the current market should not base their trading on words and expectations, they should base them on actions.
In addition, although Trump can fulfill some of his promises with the stroke of a pen, most of his promises can’t be fulfilled until Congress has their say; then it’s anyone’s guess to what will happen.
The Week ahead for Gold and Silver
Like last week, I've decided not to post any charts this week for Gold, Silver and the U.S. Dollar because they are continually breaking key support and resistance levels.
The dust apparently has not settled yet in any of these markets, and although some technical lines are showing up on the charts, the way prices are moving these lines could be broken in an instant.
So, I hope you and your family had a Happy & Safe Thanksgiving, and I hope to post next week's blog with price charts. SW
Thank You for Your Time!
Thank You for Visiting the Free Bullion Investment Guide
This Guide Gives a Portion of Every Sale to St. Jude Children's Research Hospital, Please Help Us Give to those who are Battling Cancer
by Supporting our Affiliates
(Every Advertisement on the Guide is from one of our Affiliates)
www.free-bullion-investment-guide.com
|
Support this Guide & Paypal Thank You for Your Support |
|
|
 | |||||
This website is best viewed on a desktop computer.
Keep this Guide Online
& Paypal
Thank You for
Your Support
with Feedly
Search the Guide
| search engine by freefind | advanced |
Premium Canadian Bullion
Give a lasting gift of the iconic Silver Maple Leaf bullion coin [More]
Free Shipping on Orders over $100 (CDN/USA)
or
From the U.K. Royal Mint

Daily
Newsletter
Updated Mintages for
American Gold Buffalo
American Gold Eagle
American Silver Eagle
2024 & 2025
Jerusalem of Gold Bullion
Coin photos
(bottom of page)
Mintages
for
2024
Gold & Silver Mexican Libertad
|
Gold Libertads |
Chinese Gold Coin Group Co.
& Chinese Bullion
Help Us Expand our Audience by forwarding our link
www.free-bullion-investment-guide.com.
Thank You!
Last Month's

In No Particular Order
January 2026
All Articles were Originally Posted on the Homepage
