ExpressGoldCash - 4.9 star - Customer Reviews
A Transition is Coming in
Gold and Silver's
short-term trade
Precious Metals Review and Outlook from
7/24 thru 8/4/2017
Originally Posted on 07/31/2017 @5:02 pm
by Steven Warrenfeltz
Subscribe to this Blog
Hello,
Thank you for visiting the Free-Bullion-Investment-Guide's latest blog, I hope that you and your family are having a Great Summer!
Before we get to this week's post; below are a few of Last Week's Best News Articles that were taken from this guide's homepage.

Federal Reserve now faces prospect of global monetary policy tightening - Reuters
Tapering Sends Shivers Down The ECB’s Spine - The Corner
A new gold rush is on, sparked by California’s post-drought snowmelt - The Los Angeles Times
Exclusive: London Metal Exchange to publish gold, silver reference prices within weeks - Reuters
These might be the 3 best asset classes for riding out the next financial crisis - Business Insider
Best of the Week for Nano-Particle Cancer Research
GOLD NANOPARTICLE : CANCER RESEARCH : Chennai firm to produce ayurvedic drugs for cancer thru nanotech - The Hindu - Business LineGOLD NANOPARTICLE : CANCER RESEARCH : New antibiotic delivery system could improve cancer treatment - APN Live

Middle Graphic provided courtesy of Pixabay.com
I used the word ‘Transition’ in this week's blog title because it is a shorter and simpler way of saying a ‘Directional Change’ is coming for the gold and silver, the latter being the original title of this post.
Last week’s blog post, was mostly about how gold and silver had moved through some resistance and was finding new resistance.
Gold broke back above its old resistance levels, but silver failed to do so, for the week ahead it looks like the two precious metals may find it hard to stay at these levels and pull back.
This week’s charts and analysis include: Gold, Silver, US Dollar, Platinum, Palladium and the ‘GLD.’
GOLD
In Review
Below is last week’s commentary and chart for gold:
After gold broke above the Expanding Falling Wedge's upper resistance-line, confirming the pattern, its MACD and RSI (bottom indicators) show that more upside may be in store for gold.
However, the Broken ‘Long-term Falling Trend-line’ that gold broke about a month ago, still stands as resistance in gold’s move up.
But, because gold’s price has already broken this line, it should make it easier for it to break it again in the future.
So for the week ahead, it looks like gold will have some more upside, but the old resistance line may help it to consolidate below it.
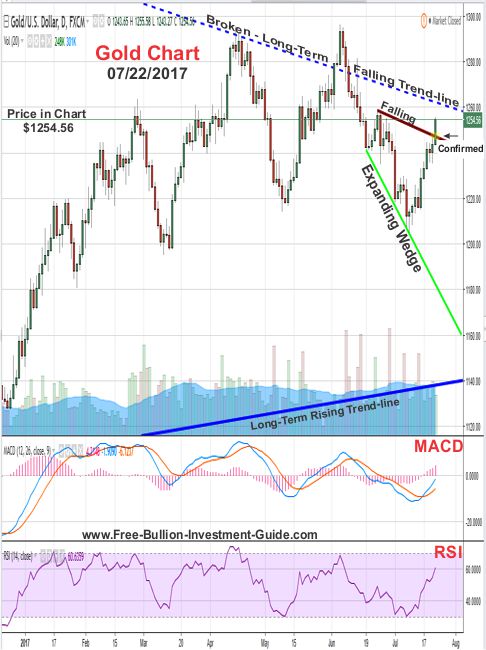
For most of the last week, gold consolidated below its 'Old Long-Term Falling Trend-line,' that was until Friday after U.S. inflation data was released.
Apparently, inflation isn’t running as high as it was a few months ago, this helped gold move back above its 'Old Trend-line' because it told the market that the Federal Reserve is less likely to raise rates.
Gold hits 6-week high after U.S. data dampens rate hike expectations - ReutersGold - This Week's Outlook
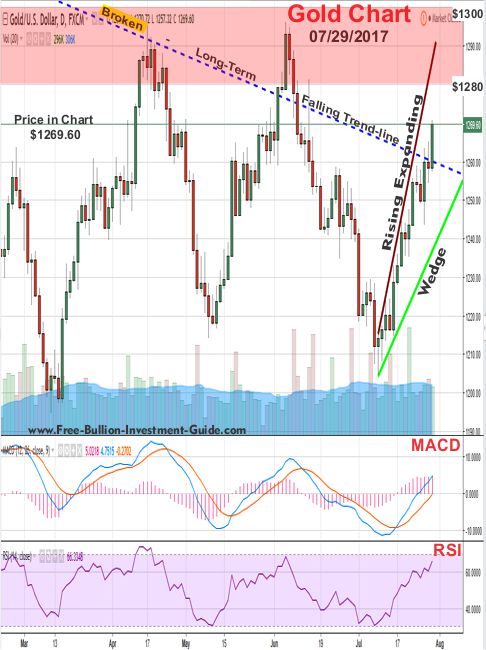
In the chart below, a 'Rising Expanding Wedge' has been identified in gold’s chart.
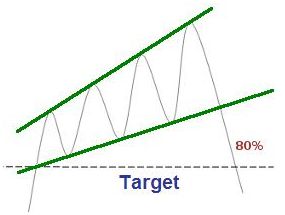
As you can see in the small example chart, to the right, a rising expanding wedge is a negative pattern.
However, Gold’s MACD and RSI are indicating that perhaps gold may try to hold this level or try to move higher.
But, there’s a lot of resistance between the $1280 to $1300 price levels, so if gold does move up it's doubtful it will push above this level at this time.
Plus, the 'Rising Expanding Wedge' is telling us a transition will happen sometime in the near future for gold, so unless something fundamentally changes, it seems pretty likely that by the end of this week we will be looking at a lower price than we see today.
Charts provided courtesy of TradingView.com
Gold's Price Resistance and
Support Levels
Gold's Resistance Levels
$1300.00
$1280.00
Gold's Support Levels
$1260.00
$1240.00
SILVER
In Review
Below is last week’s silver chart and commentary:
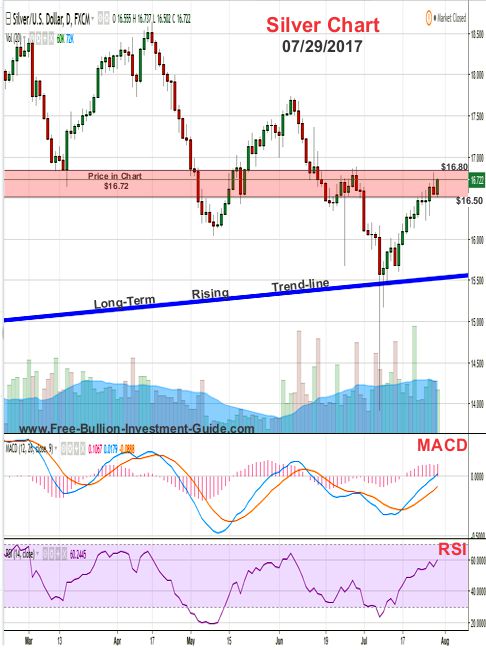
Now that silver has moved passed above the Falling Wedge, its price is currently hitting resistance at $16.50.
However, its MACD and RSI are giving an indication that it is going to move higher, but when it reaches the $16.80 to $17.20 level it will find tougher resistance.
So we may see it move up this week, but expect to see some resistance/consolidation before silver reaches the red highlighted area in the chart below.
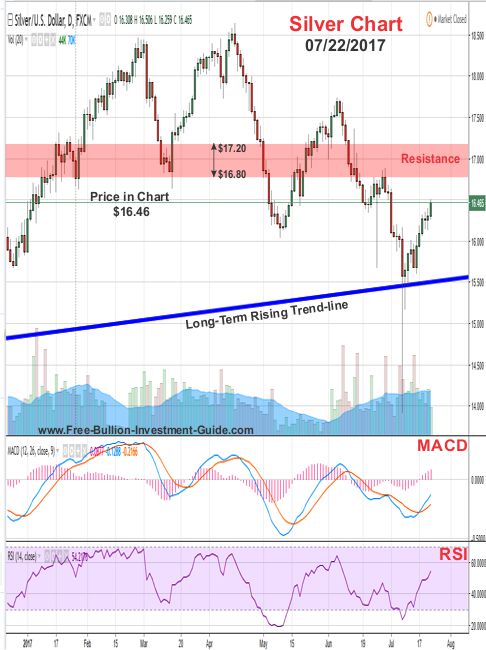
In review of last week commentary, as you can see in the chart below, silver first consolidated for a couple of days below the $16.50 level, then it broke higher reaching a high of $16.80, but it fell back to close the week at $16.72
(continued....)
Silver - This Week's Outlook
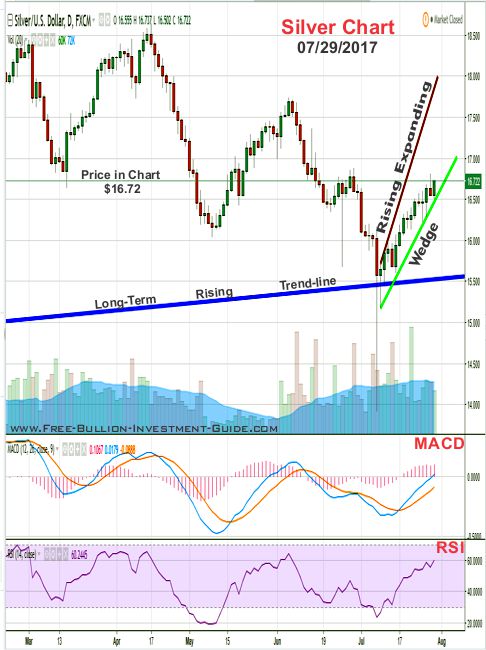
For the week to come, silver’s MACD and RSI are indicating that it may move a little higher, but like gold, it too has formed a negative ‘Rising Expanding Wedge,’ so a change in direction or transition is expected for silver in the near future.
Note: One thing to keep your eye on is Silver’s Long-term Rising Trend-line, it needs to stay above this line because if it falls below it, silver will fall lower and it could retest 2015’s low of $13.60 a troy ounce.
charts provided courtesy of TradingView.com
Silver's Price Resistance &
Support Levels
Silver's Resistance Levels
$17.00
$16.80
Silver's Support Levels
$16.50
$16.00
US DOLLAR
In Review
Below is last week’s commentary and chart outlook for the U.S. Dollar;
“…last week, the U.S. Dollar broke below the descending channel, and its future is not looking bright.
However, for the immediate future, the dollar looks like it may be bottoming out, its RSI and MACD are moving at the bottom of their indicators and the dollar has been moving consistently lower for almost two weeks, so some sort of upside correction is expected.”
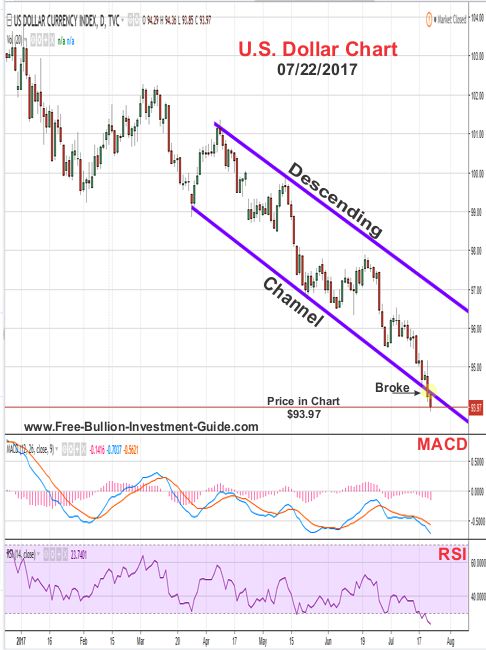
Last week, the U.S. Dollar barely bounced off its bottom, and unlike what I expected, its MACD and RSI fell to levels not seen since 2012.
U.S. Dollar - This Week's Outlook
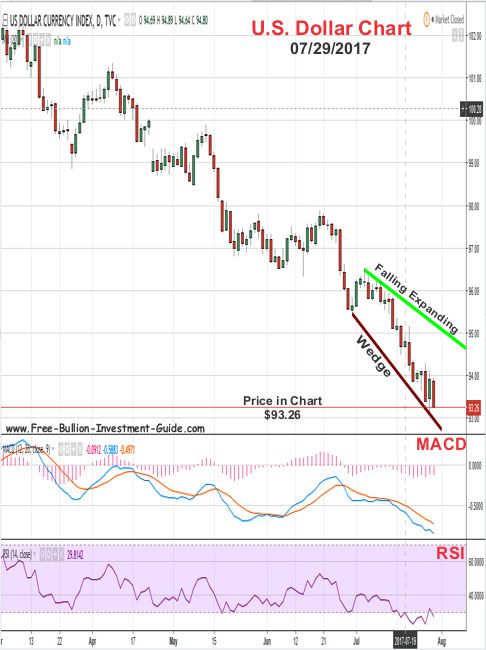
The opposite of what we’ve seen in gold and silver’s chart has now been identified in the U.S. Dollar chart, below.
A ‘Falling Expanding Wedge’ has been identified in the U.S. Dollar chart and it is a positive indicator, so sometime in the near future we should see a rise in the U.S. Dollar.
Plus, as the chart shows it is expected to rise up to the $94.50 to $95.00 price level to break the upper resistance trend-line of the ‘expanding falling wedge.’
Charts provided courtesy of TradingView.com
U.S. Dollar's Price Resistance and Support Levels
U.S. Dollar's Resistance Levels
$95.50
$94.50
U.S. Dollar's Support Levels
$93.00
$92.00
PLATINUM
In Review
Below is last week’s commentary and chart for Platinum:
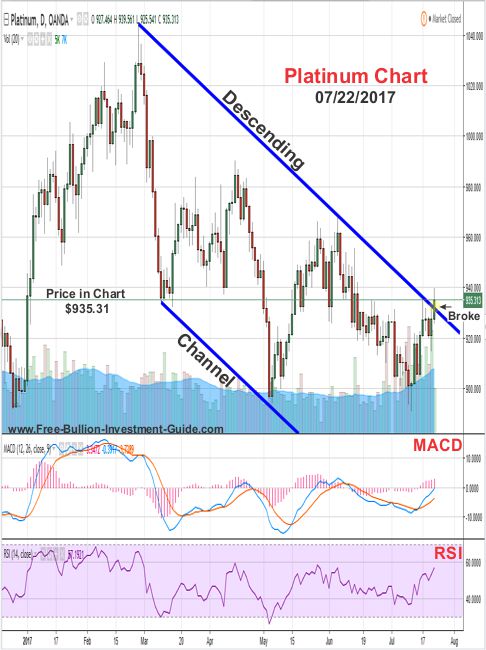
As you can see in the chart below, last week Platinum did test the upper trend-line of its descending channel and broke it.
Note: All channels break, when they do, it's a sign that the old sentiment has been broken and a new outlook is in store for the asset.
For Platinum, this is a good sign that its price will stop falling inside this channel.
In the immediate future, no clear patterns have formed in Platinum's chart, its MACD looks like it may rise this week, but the price will be hitting a lot of resistance between the $940-$960 price levels, so we may see it move up to this price area then consolidate; time will tell.
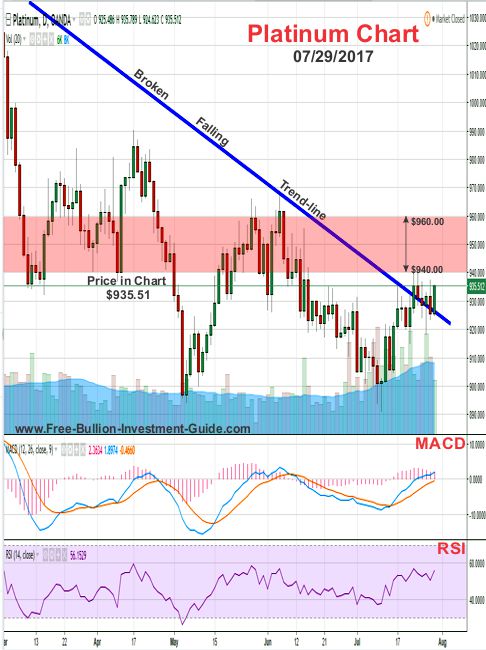
As you can see in the chart below, the $940 to $960 price level has continued to be strong resistance for Platinum.
PLATINUM - This Week' Outlook
In the chart below, I kept the top of the descending channel in this week's chart so you could see where it comes into play.
For the week ahead, no clear pattern has formed in Platinum's chart.
In addition, Platinum's MACD and RSI are giving mixed signals, its MACD looks like it is about to roll over, while its RSI looks like it may go higher.
Therefore, there is no clear indication as to which way platinum's price will move this week, although the resistance level from last week should continue to weigh on Platinum's price.
Charts provided courtesy of TradingView.com
Platinum's Price
Resistance and Support Levels
Platinum's Resistance Levels
$960.00
$940.00
Platinum's Support Levels
$920.00
$910.00
PALLADIUM
In Review
Below is Palladium’s commentary and chart from last week’s outlook:
This week, the lower indicators aren’t giving much of indication as to which way the price of palladium will move.
But, the price chart looks like it may stop falling, so it could be ready to break the falling wedge’s upper resistance-line.
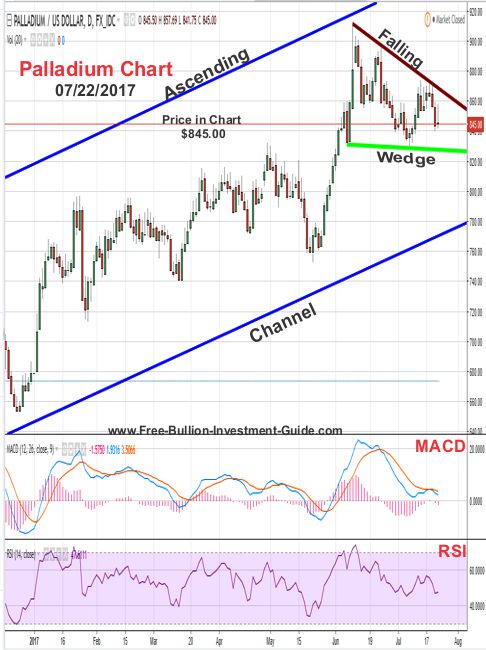
Last week, the price did stop falling and in doing so, it rose in price and confirmed the 'falling wedge' in palladium’s price chart (below).
Palladium - This Week's Outlook
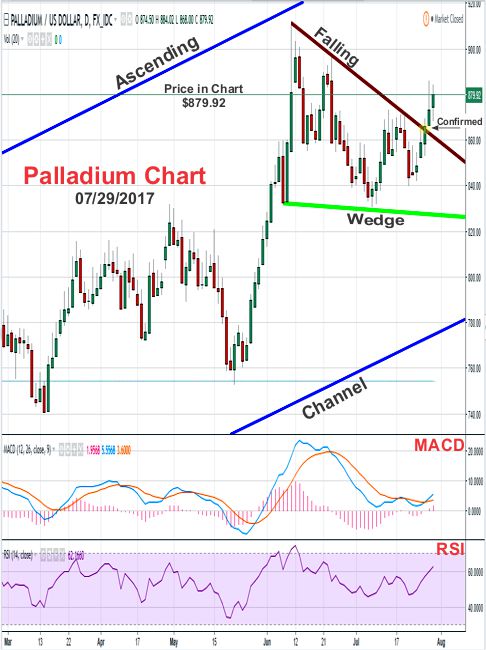
Like Platinum, no clear patterns have formed in palladium’s chart, although its MACD and RSI look like the price of the precious metal could move up a little more, but the $890 to $910 price level will weigh heavily on the price and for this week (at least) we should see some consolidation below this level.
Charts provided courtesy of TradingView.com
Palladium's Price Resistance and Support Levels
Palladium's Resistance Levels
$885.00
$860.00
Palladium's Support Levels
$830.00
$800.00
GLD - Gold ETF
The last two week’s I’ve offered commentary for the HUI and GDX, both have very similar technical patterns in their charts, and they continue to trade inside those patterns.
This week, I'm reviewing the GLD ETF chart.
I
rarely follow the GLD because its price moves very closely to Gold's price.
You can see an example of this in the chart below, the candlestick chart is of the GLD, and the XAU/USD is in orange over it.
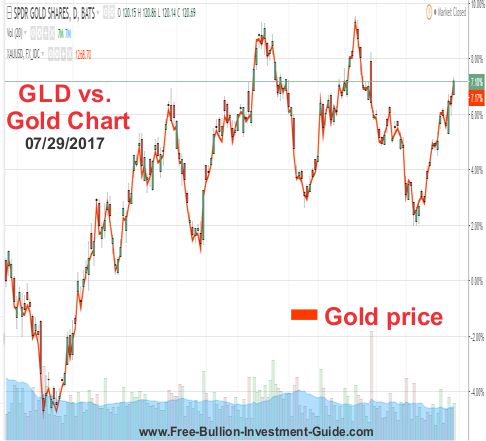
Below is the GLD's chart, like gold (in the top section of this blog) it too has a rising expanding wedge, so like gold, after the GLD has confirmed this wedge (or not), I will follow up on it.
But sometime soon, like gold, its price looks like it will be falling.
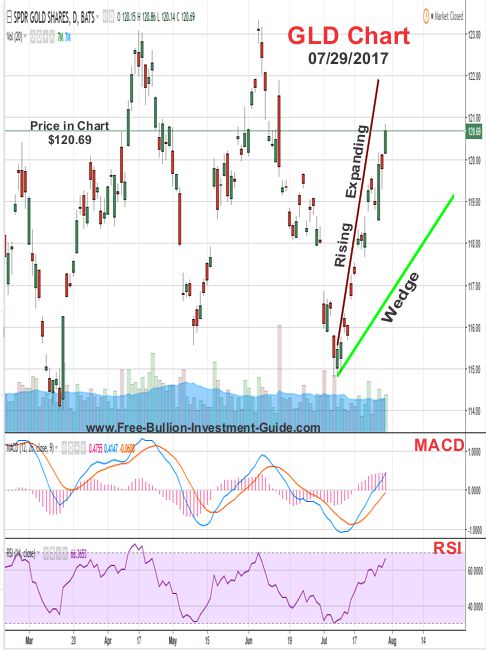
Charts provided courtesy of TradingView.com
Thank You for Your Time.
Have a Great Week.
God Bless, Steve
'Click Here' see all of the prior Blog posts,
Thank You for Your Time!
|
Support this Guide & Paypal Thank You for Your Support |
|
|
 | |||||

This website is best viewed on a desktop computer.
Keep this Guide Online
& Paypal
Thank You for
Your Support
with Feedly
Search the Guide
| search engine by freefind | advanced |
Premium Canadian Bullion
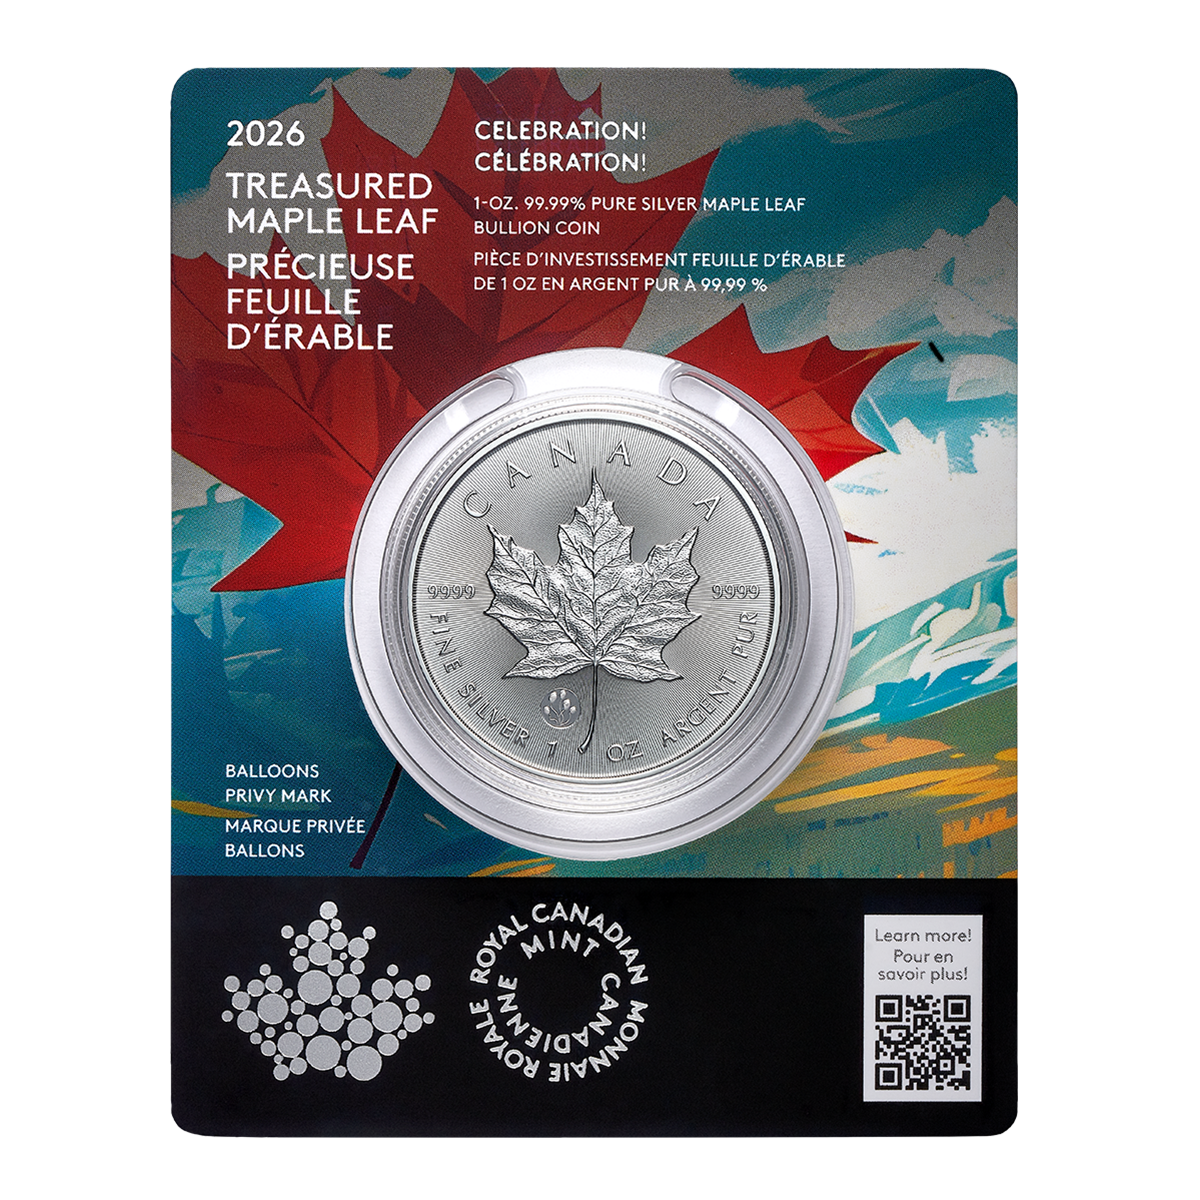
Give a lasting gift of the iconic Silver Maple Leaf bullion coin [More]
Free Shipping on Orders over $100 (CDN/USA)
or
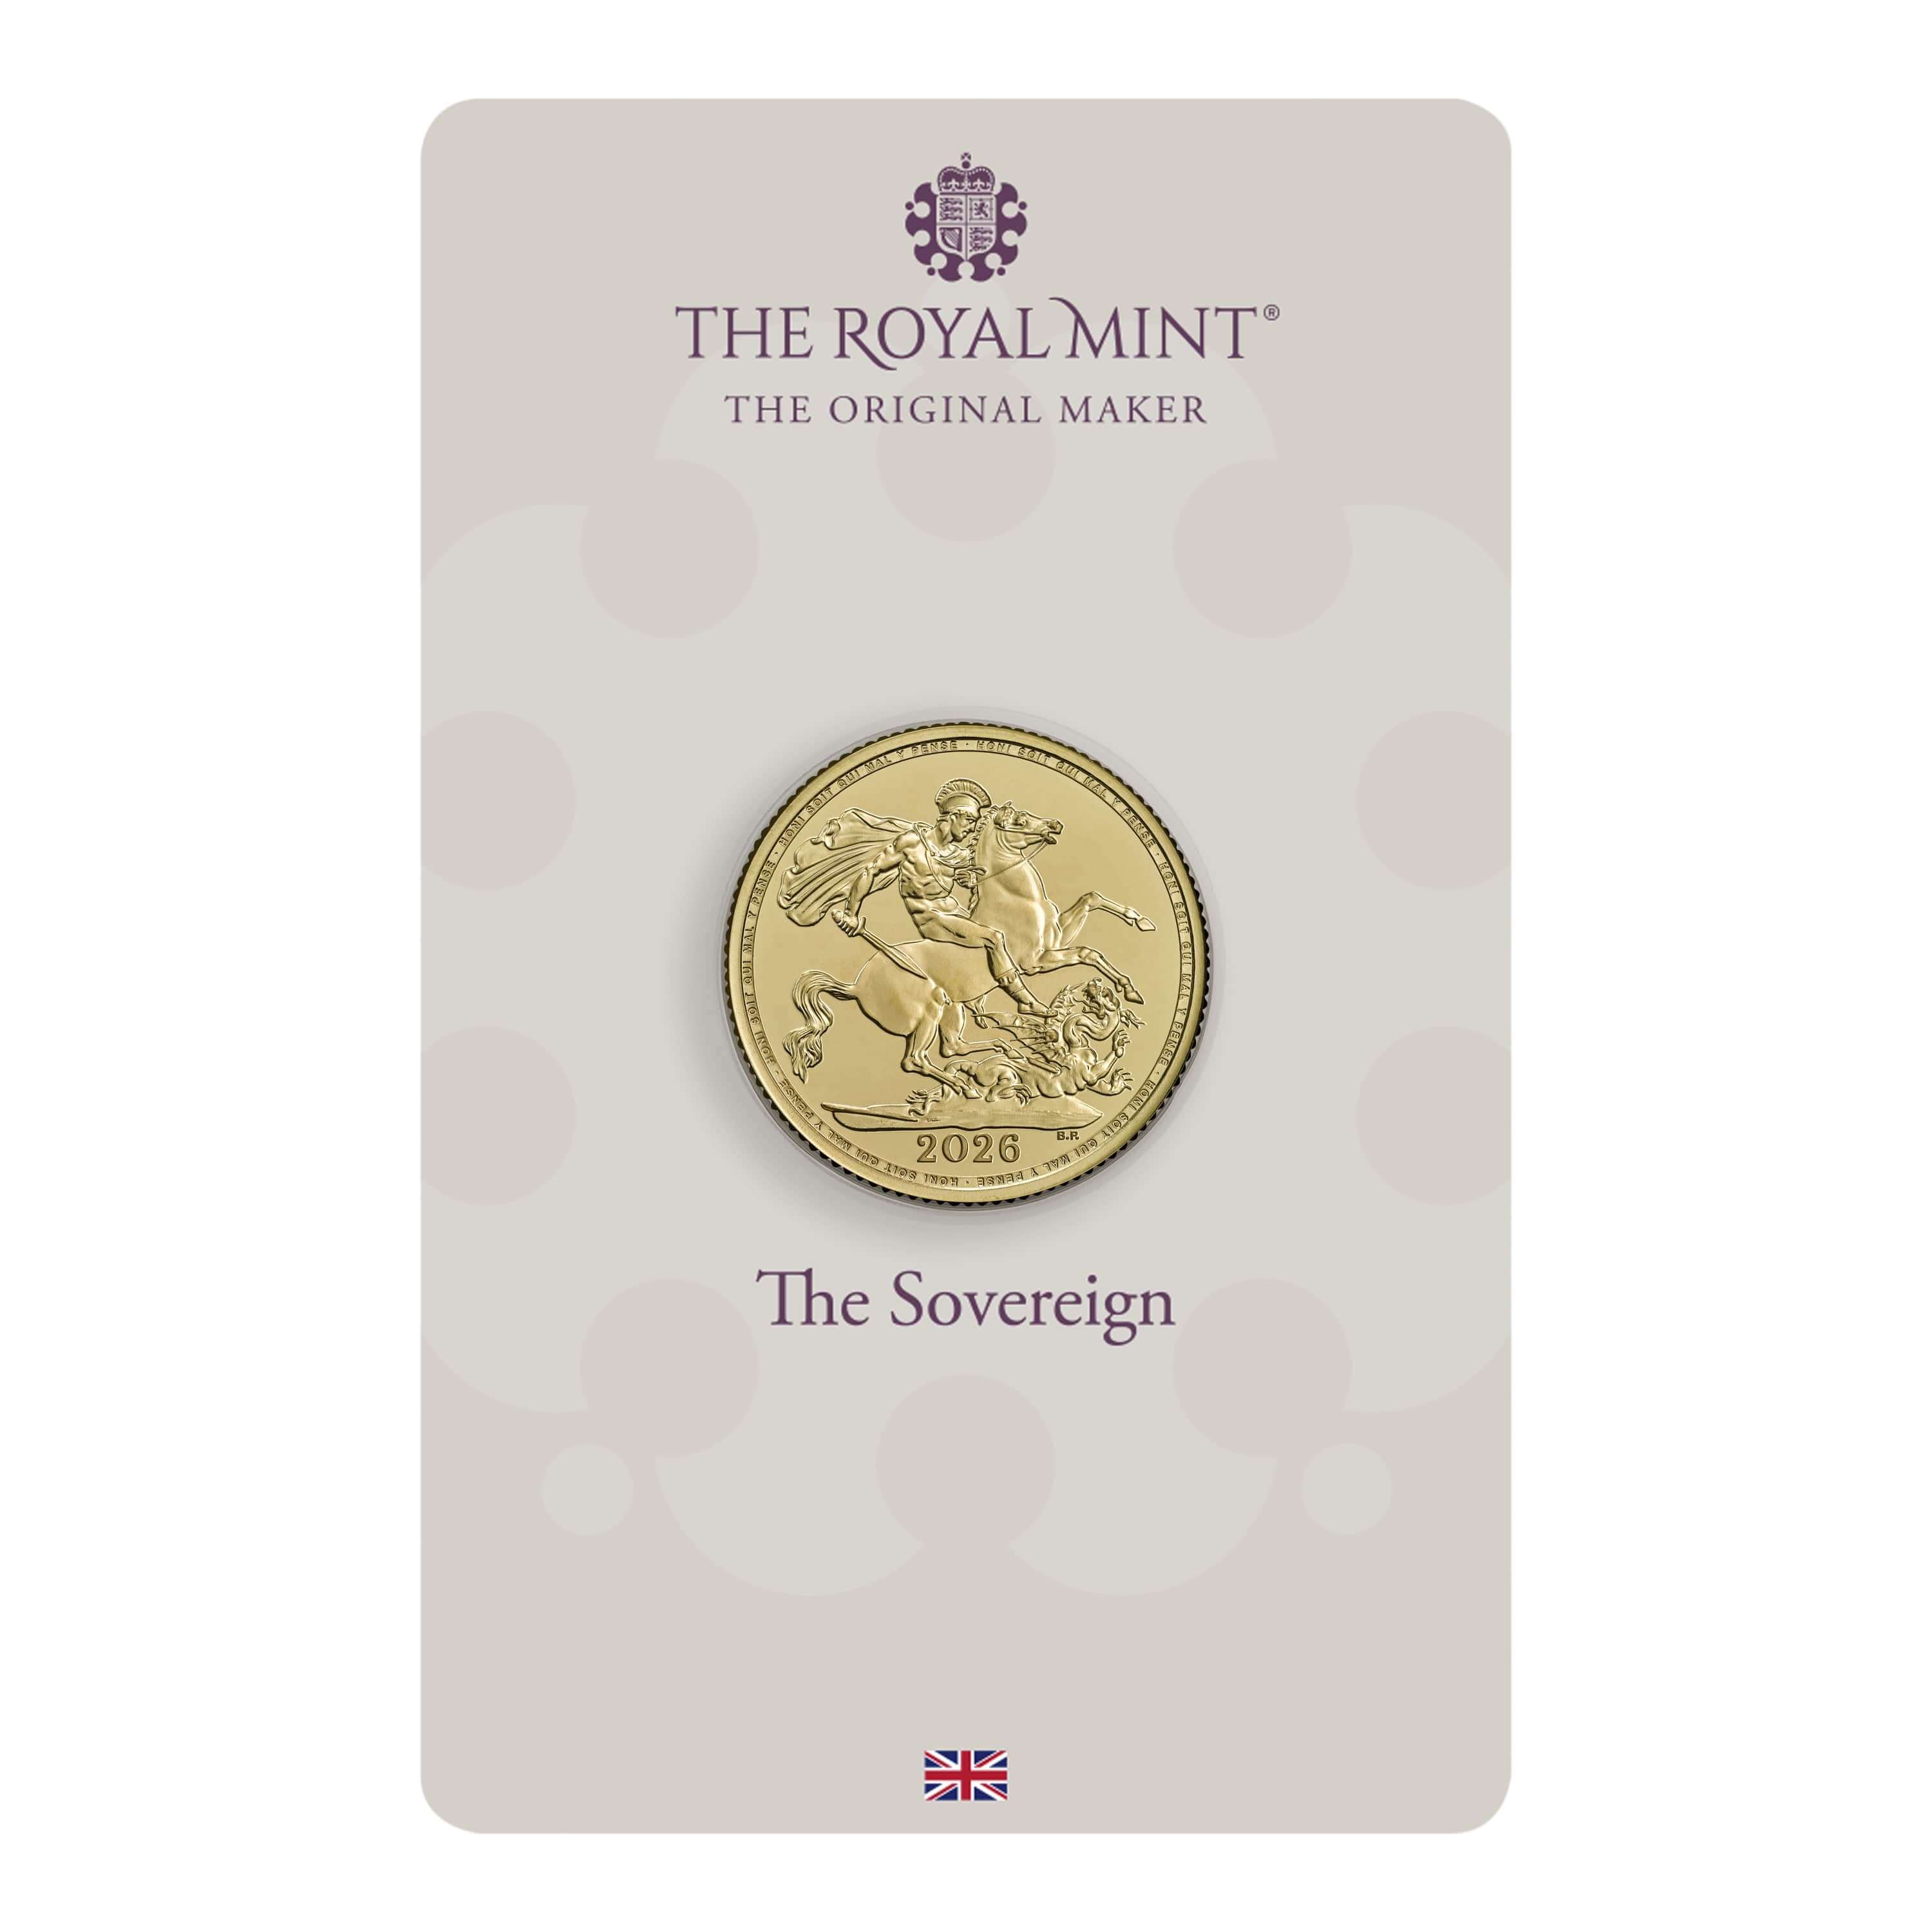
From the U.K. Royal Mint

Daily
Newsletter
Updated Mintages for
American Gold Buffalo
American Gold Eagle
American Silver Eagle
2024 & 2025
Jerusalem of Gold Bullion
Coin photos
(bottom of page)
Mintages
for
2024
Gold & Silver Mexican Libertad
|
Gold Libertads |
Chinese Gold Coin Group Co.
& Chinese Bullion
Help Us Expand our Audience by forwarding our link
www.free-bullion-investment-guide.com.
Thank You!
Last Month's

In No Particular Order
November 2025
All Articles were Originally Posted on the Homepage
