Precious Metals and the
Federal Funds Rate
Precious Metals Review & Outlook
03/13/2017 thru 03/27/2017
Originally Posted on 03/20/2017 @3:44pm
Subscribe to this Weekly Blog post
Hello,
Thank you for visiting the Free-Bullion-Investment-Guide's latest blog post, I hope that you and your family had a great week.
Before we get to this week's post; here are a few of Last Week's Best News Articles that were taken from this guide's homepage.

BullionVault - Gold Bullion Holds $1200 as US Inflation Confirms 5-Year High Before Fed, But Crude Oil Sinks
True Wealth Publishing - What Naughty Kids and the U.S. Interest Rate Hike have in Common
The Week - Will the Fed Repeat its Inflation Mistake?
DiMartino Booth - The Corporate Bond Market: The Start of the Matter
Market Watch - Why rising stock ownership by U.S. households may be a bad omen
The Deviant Investor - Death, Debt, Devaluation and Taxes
Best of the Week for Gold NanoParticle Cancer Research
GOLD NANOTECHNOLOGY : NanoWerk - Creating Protein Crystals from Gold
Precious Metals and
the Federal Funds Rate
Last week’s post titled ‘Is Janet Yellen Bluffing?’ was actually a trick question because my conclusion was; No, she isn't.
But she is creating a ‘bluff,’ to know what I mean, you'll need to view the post, or you can wait until next week when the first ‘part’ of ‘Yellen’s Bluff’ is posted.
In addition, near the end of last week’s post, I decided to
offer just a review of gold and silver and no outlook because the markets were
moving erratic in their wait to see if the Federal Reserve would raise the Federal Funds rate or not.
The biggest thing precious metals investors need to remember is that it is the US Dollar that influences the price of precious metals not the Federal Funds rate.
The Federal Funds Rate is the interest rate at which banks and other banking institutions lend money to each other, usually on an overnight basis and it is a bench mark for other interest rates; see here.
The Federal Funds rate strengthens the US Dollar, it doesn’t hurt gold, in fact, the Federal Funds Rate and Gold have very little Correlation.
The chart below is a comparison
chart of the price of Gold & the Federal Funds Rate from 2004 – 2009.
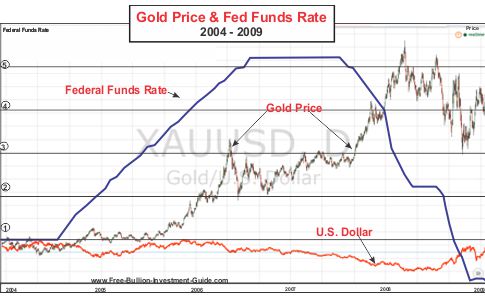
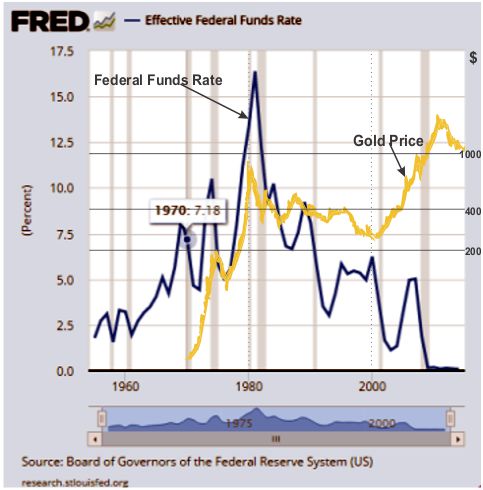
As you can see, the rise of the Interest rate had very little effect on the price of gold, but instead, it was the effect that the rate had on the US Dollar that determined whether or not gold rose or fell.
The next chart below was taken from the 3rd quarter of 2015 – quarterly report, in a section titled: The Federal Funds Rate Relationship with the U.S. Dollar & Gold, in it, it shows you the entire relationship of the un-pegged price of gold and the Federal Funds Rate.
The following statement was taken from that 3rd qtr of 2015 page:
“The most glaring observation, in the chart above, is the lack of influence that the Federal Funds rate has made on gold.”
Gold’s fall over the last few weeks has everything to do with the market's expectation of an interest rate hike and the Federal Reserve to be stern in their forecasts for future hikes in the Federal Funds rate.
The reason gold rose after the rate hike has everything to do with the market expecting to get hawkish language out of the Fed, but they only heard doves, so the US dollar sold off.
Because of this, all of the precious metals rose in price and are now showing some very positive indicators, in their charts.
Before I move on to the charts, I wanted to let you know that this week and in the weeks to come, the chart analysis will start with Silver, instead of Gold.
After the post 'The Freak is Back on a Leash,' it only makes sense to do so, since the Silver usually leads Gold in their price trade.
SILVER
In the silver chart below, I was able to find several positive trend-lines, first off the 'Old Falling Expanding Wedge' has become mostly irrelevant and it will be removed in next week's chart.
But, it is relevant to show you where this pattern sits on today's chart.
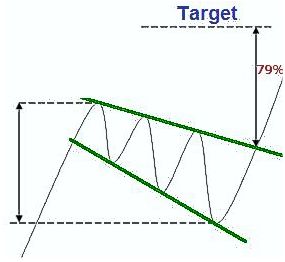
A 'Falling Expanding Wedge' is a bullish pattern and the old one was destroyed a little over a week ago, after the price of silver fell below the upper trend-line of the wedge.
However, silver has created a new one (so has gold) and it looks like this week it will break above the upper falling part of the wedge; the MACD and RSI (lower indicators) are also showing this.
Note: Click the chart (to the right) of a 'Falling Expanding Wedge' for Forex-Central's definition of the technical pattern.
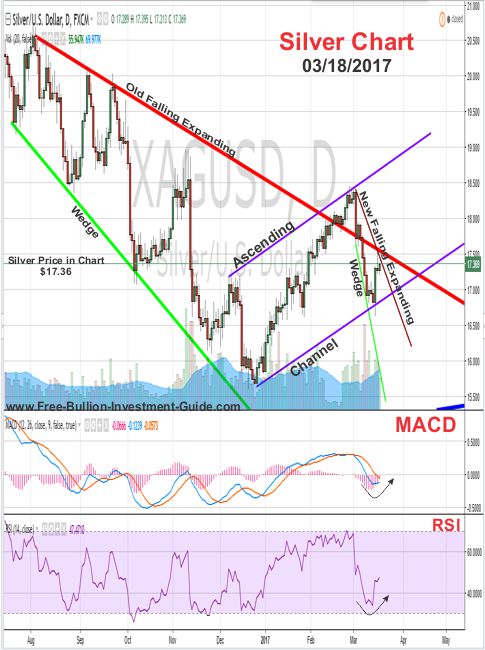
An ascending channel has also been identified on silver's chart, and although it is very narrow and I expect silver to break out of it sometime in the near future, as long as it trades inside of it or breaks above it, it will be another positive sign for silver's future.
Silver's Price Resistance &
Support Levels
Silver's Resistance Level
$18.15
$18.00
Silver's Support Level
$17.25
$17.10
$16.95
GOLD
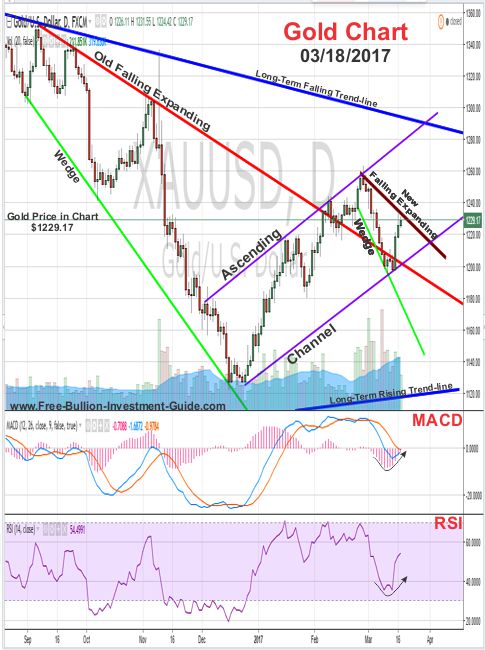
Gold's chart is nearly identical to silver's chart, except for gold's position in relation to the old expanding falling wedge.
Like Silver, Gold's 'Old Falling Expanding Wedge has become irrelevant, but its good to see where it sits in relation to the new patterns in gold's chart.
(continued...)
Charts provided courtesy of TradingView.com
Gold's MACD and RSI (lower indicators) are indicating that momentum in its trade is changing direction and looks like gold will be breaking above the upper trend-line of the New Falling Expanding Wedge.
Gold is also trading inside an Ascending Channel and it looks like this week gold will continue to trade in it.
Gold's Price Resistance and
Support Levels
Gold's Resistance Level
$1265.00
$1250.00
Gold's Support Levels
$1225.00
$1200.00
$1180.00
US DOLLAR
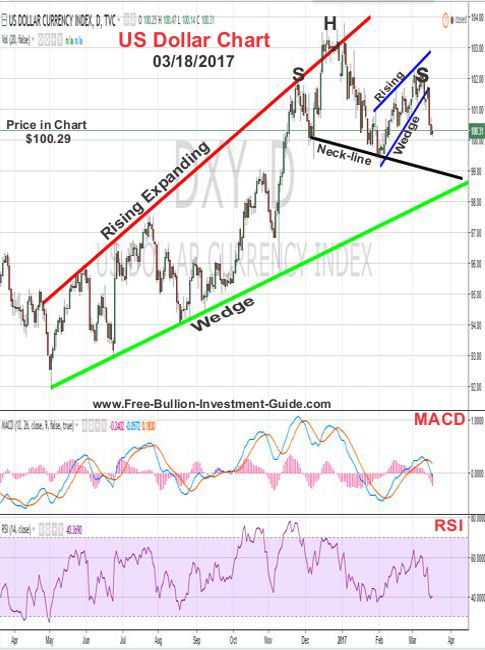
In the US Dollar chart, there is a lot going on.
The chart is filled with negative patterns, some have been fulfilled, others are still in the process.
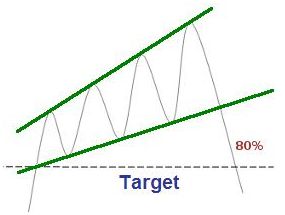
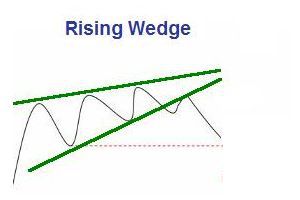
First, the Rising Expanding Wedge is still intact, it's a bearish sign for the U.S. Dollar, meaning for the U.S. Dollar is trading inside a negative pattern.
The two blue lines in the chart indicate a Rising Wedge pattern, another negative pattern that has been fulfilled.
The other negative pattern that is showing up in the US Dollar chart is a Head and Shoulders pattern.
If the price of the US Dollar passes below the Neck-line on the chart, the Head and Shoulders pattern will be fulfilled. Time will tell.
Note: Click the chart above for Forex-Central's definition of the Rising Expanding Wedge or 'Ascending Broadening Wedge.'
U.S. Dollar's Price Resistance and Support Levels
U.S. Dollar's Resistance Level
$101.40
$101.00
U.S. Dollar's Support Level
$100.00
$99.75
Platinum
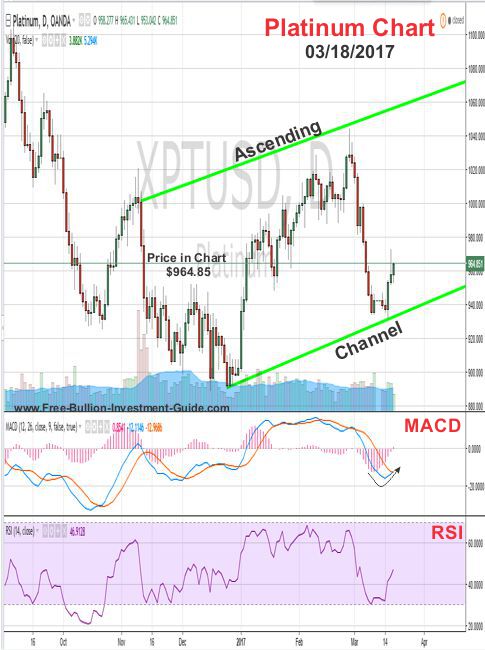
Platinum’s chart isn’t showing much, but like gold and silver, it got knocked down by the market anticipating a higher dollar.
After the dollar’s fall on March 15th, Platinum started to move back up, and in the process, it has developed an ascending channel.
Platinum’s chart isn’t giving much of an indication as to what it will do this week, except its MACD looks like it is about to change direction, so it may continue to move up throughout the week, inside its new ascending channel.
Platinum's Price Resistance and Support Levels
Platinum's Resistance Level
$1015.00
$1000.00
$980.00
Platinum's Support Level
$960.00
$935.00
Palladium
Palladium broke below its rising wedge two weeks ago on
March 6th, fulfilling the negative pattern. The last precious metal to do it after the 'Recurring Themes' post.
However, the pattern proved not to be too negative for the precious metal and it moved up in price for most of last week.
Furthermore, Palladium has been trading inside an Ascending Channel since Jan. 2016, and it should continue to do so in the near future.
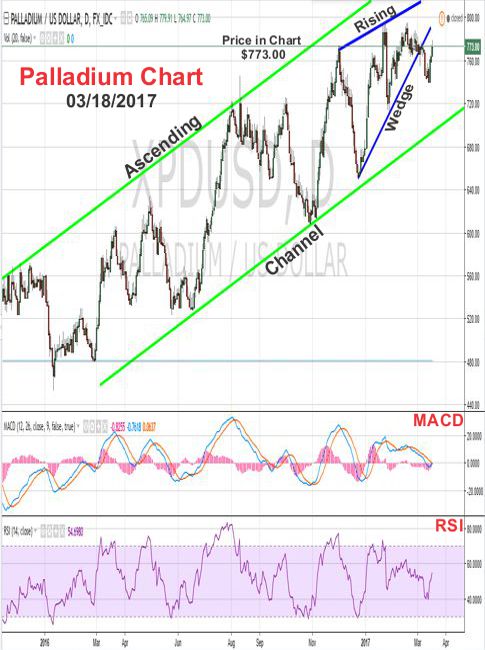
Palladium's Price Resistance and Support Levels
Palladium's Resistance Level
$800.00
$785.00
Palladium's Support Level
$770.00
$740.00
Tribute
Lastly, I wanted to pay tribute to my cousin who passed away last week.
I've spent the last ten Thanksgivings with him and his family.
Ever since I've known, my cousin Billy was always the one everyone gravitated too because he always had a story to tell and you were usually laughing at the end of it.
He was born on May 18th, 1931, and was a veteran of the Korean War as a Paratrooper in the 101st Airborne Division.
God Bless You William 'Billy' Bart, you'll be missed.
Music
Here's a song from a Rockn'Roll Legend of Billy's era that we sadly lost yesterday.
Chuck Berry - Johnny B. Good
Have a Great Week.
Thank you for your time & God Bless,
Steve
Thank You for Visiting the Free Bullion Investment Guide
This Guide gives 50% or more of what it earns to those who are Battling Cancer.
Please Help Us Give by Supporting our Affiliates.
(Every Advertisement on the Guide is from one of our Affiliates)
'Click Here' see all of the prior Blog posts,
Thank You for Your Time!
|
Support this Guide & Paypal Thank You for Your Support |
|
|
 | |||||
This website is best viewed on a desktop computer.
Keep this Guide Online
& Paypal
Thank You for
Your Support
with Feedly
Search the Guide
| search engine by freefind | advanced |
Premium Canadian Bullion
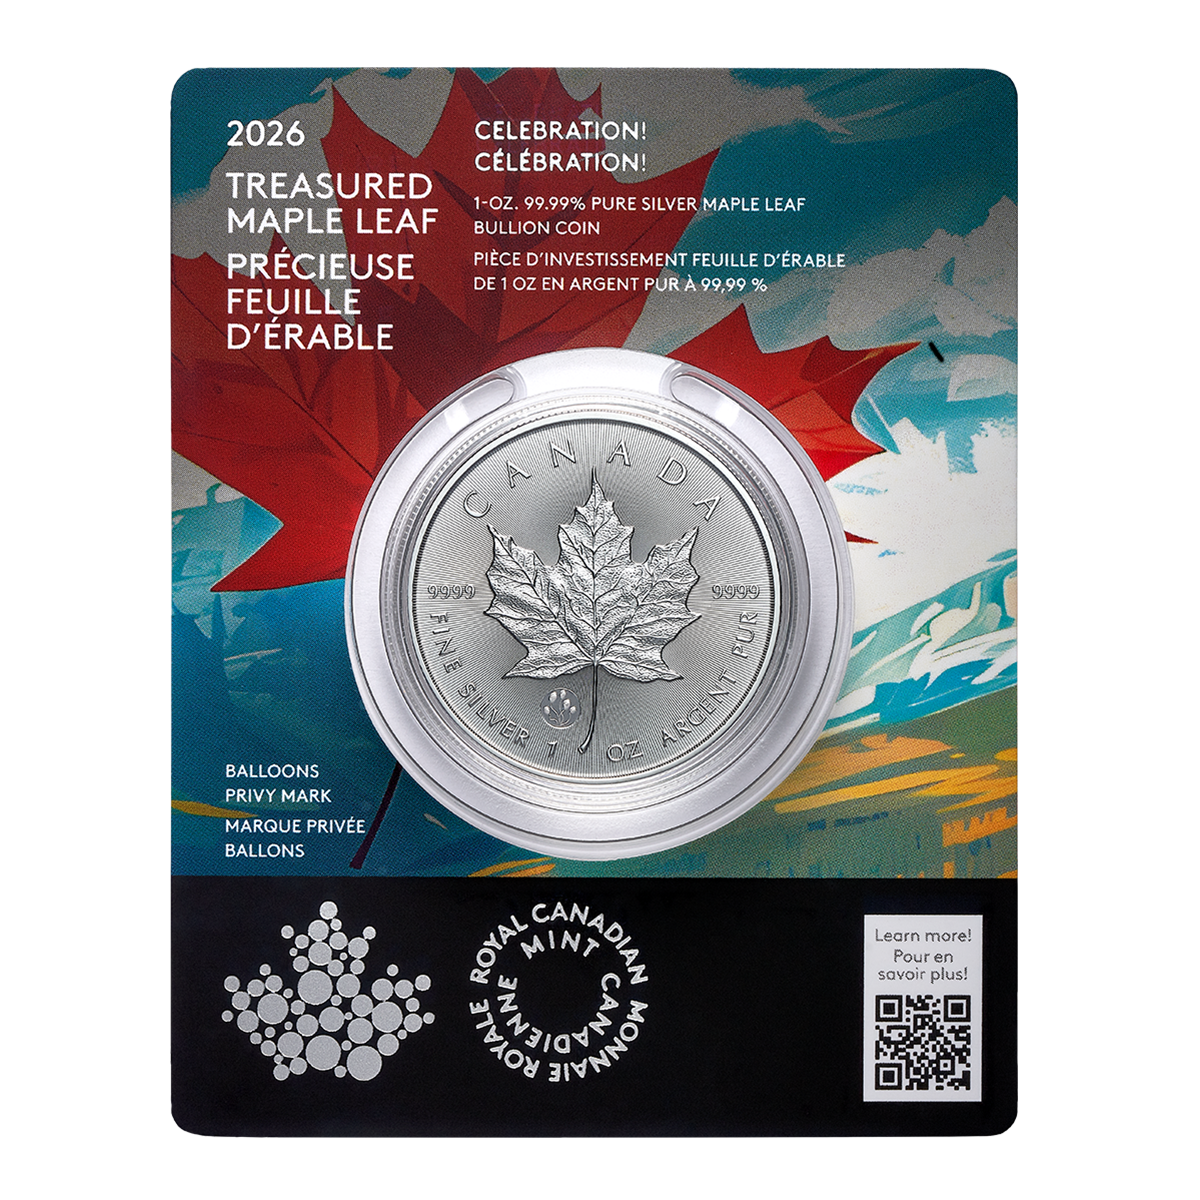
Give a lasting gift of the iconic Silver Maple Leaf bullion coin [More]
Free Shipping on Orders over $100 (CDN/USA)
or
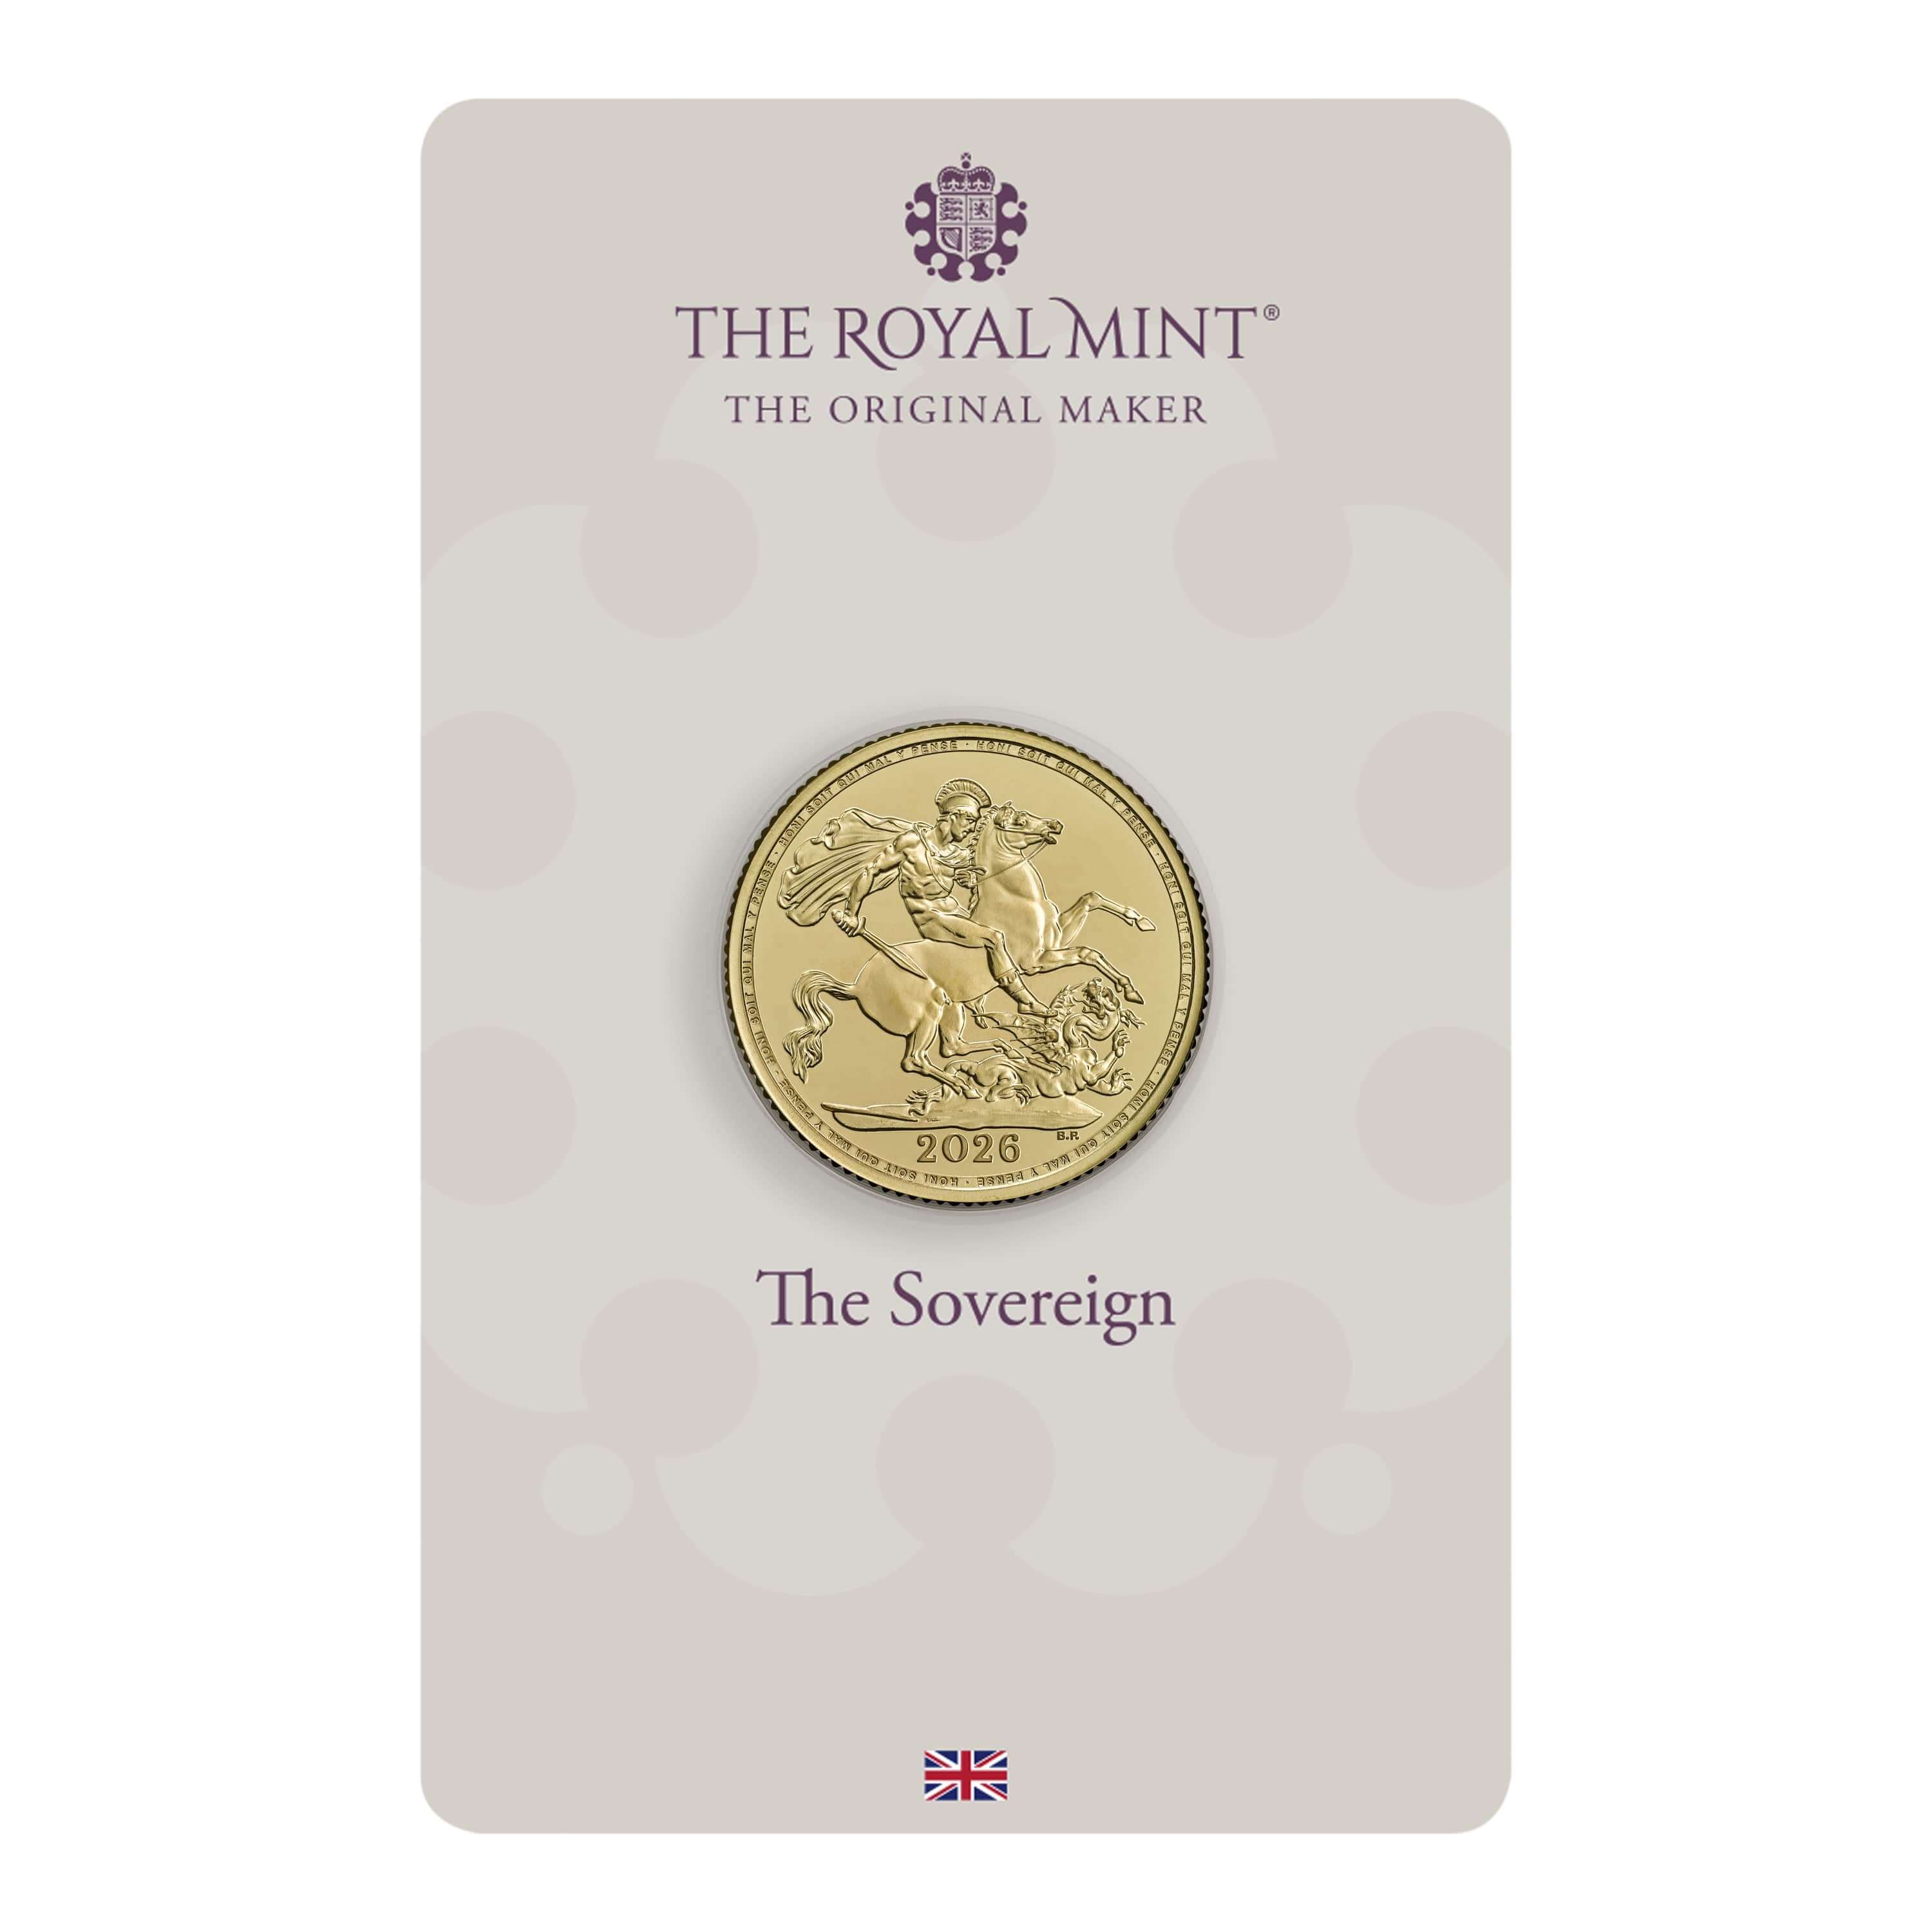
From the U.K. Royal Mint

Daily
Newsletter
Updated Mintages for
American Gold Buffalo
American Gold Eagle
American Silver Eagle
2024 & 2025
Jerusalem of Gold Bullion
Coin photos
(bottom of page)
Mintages
for
2024
Gold & Silver Mexican Libertad
|
Gold Libertads |
Chinese Gold Coin Group Co.
& Chinese Bullion
Help Us Expand our Audience by forwarding our link
www.free-bullion-investment-guide.com.
Thank You!
Last Month's

In No Particular Order
January 2026
All Articles were Originally Posted on the Homepage

