Precious Metals
Review and Outlook
01/23 thru 02/03/2017
Gold, Silver, the U.S. Dollar, Platinum & Palladium
Originally Posted on 01/30/2017 @4:03pm
Precious Metals Review & Outlook
Hello,
I hope that you and your family have been safe and well.
Like last week, I'm going to skip doing an intro and go straight to the charts.
The order of this week’s Charts & Analysis are as follows: Gold, Silver, U.S. Dollar, Platinum & Palladium.
GOLD
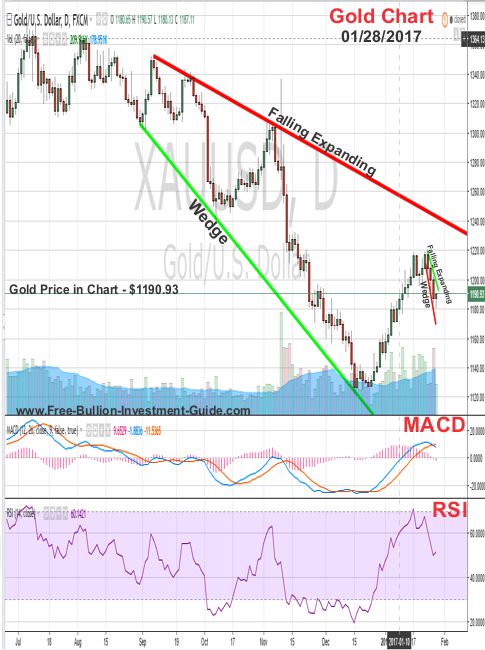
Last week, gold attempted to move up, but it hit resistance at the $1220 level on Monday (1/23).
For the rest of the week, gold's price fell ending the week below $1200 at $1190.93.
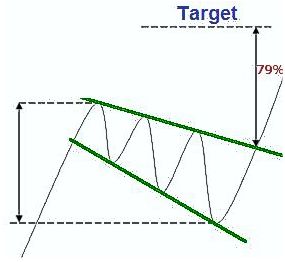
In the chart below, you can see that as gold fell in price last week, it created a mini falling expanding wedge, inside the larger expanding wedge that dates back to September 2016.
The price could continue to fall in price, expanding the wedge, or it could make a bounce and reverse in price now or later this week.
Time will tell which way it moves, but we may see a little more ‘consolidation or profit taking’ before this mini expanding wedge plays out.
Note:
Click the chart to the right for Forex-Central's definition of a 'Falling Expanding Wedge' also known as a 'Descending Broadening Wedge.'
Gold's Price Resistance &
Support Levels
Gold's Resistance Level
$1250.00
$1220.00
$1200.00
Gold's Support Levels
$1180.00
$1170.00
$1150.00
SILVER
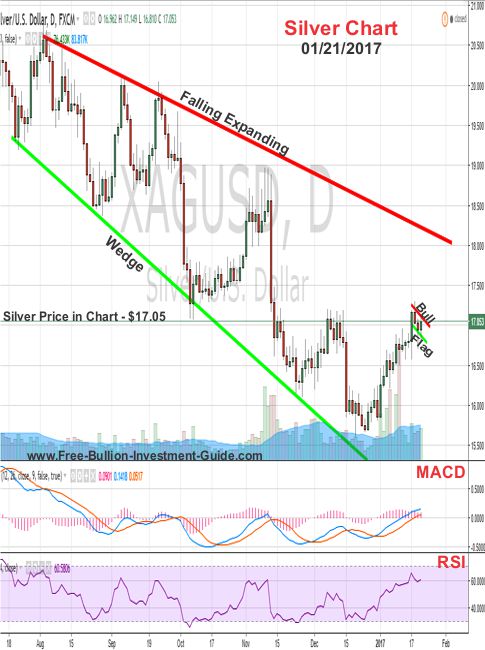
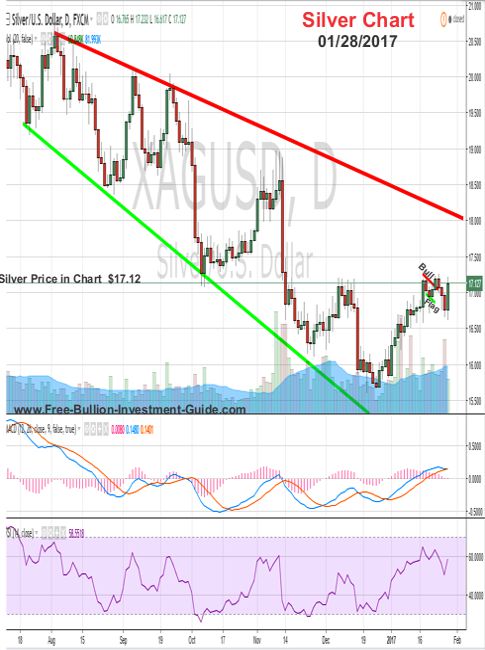
Last week, the chart below was posted for silver; in it, I indicated that silver had formed a ‘Bull Flag.’
Charts provided courtesy of TradingView.com
On Monday (01/23) silver broke above the bull flag, but then on Tuesday, Wednesday, and Thursday it fell back below it.
But silver ended the week back above $17.00 at $17.12; seven cents above where it started the week.
As for next week, silver’s chart isn’t giving any clear indications as to which way it will move.
The silver chart (below) is not showing any patterns; the MACD is slightly above the ‘Zero’ line, and the 'signal line' is flat and giving no signal.
Furthermore, silver’s RSI (Relative Strength Indicator) is sitting slightly above the midway point which basically tells us the price could go either way this week.
Silver's Price Resistance and
Support Levels
Silver's Resistance Level
$17.50
$17.25
Silver's Support Level
$16.75
$16.65
US DOLLAR
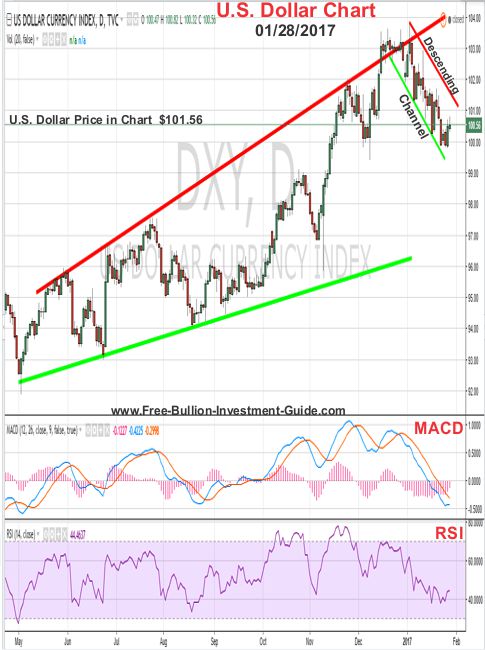
Last week, it was stated on this blog that the U.S. Dollar looked like it was going to trade between $101.00 and $100.00 and that’s what happened.
The dollar didn’t move much last week; it continues to trade in the ‘Descending Channel’ indicated in the chart below.
As for the week ahead, the U.S. Dollar’s MACD and RSI are both sitting in oversold territory, so the price of the dollar should correct this week and move up, but stay within the trend-lines of the Descending Channel.
(continued…)
Charts provided courtesy of TradingView.com
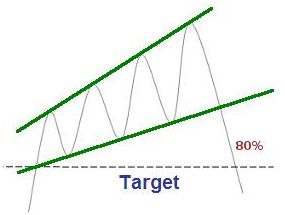
In addition, the expanding rising wedge in the U.S. dollar chart continues to be a negative sign for the dollar.
Note: Click the chart to the right for Forex-Central's definition of a Rising Expanding Wedge or 'Ascending Broadening Wedge.'
U.S. Dollar's Price Resistance and Support Levels
U.S. Dollar's Resistance Level
$103.50
$102.90
$101.00
U.S. Dollar's Support Level
$100.00
$99.75
$99.00
Platinum
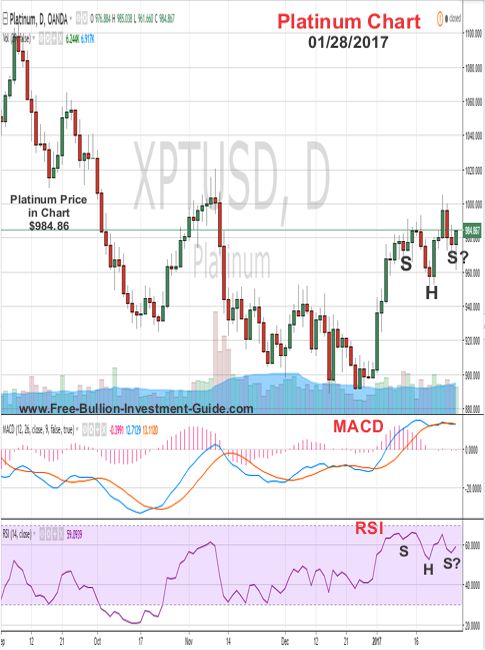
Last week Platinum consolidated in price.
Platinum’s chart looks like it may be showing an inverse ‘head and
shoulder’s pattern, which I indicated it in the chart below, but only to show you.
I say this because the MACD is moving in oversold territory, and it doesn’t look like the pattern will play itself out.
But, I could be wrong; Ultimately, time will be the judge.
If I am wrong, and the inverse head and shoulder pattern does play itself out, the price of Platinum will break above $1000.00 a troy ounce soon.
Charts provided courtesy of TradingView.com
Palladium
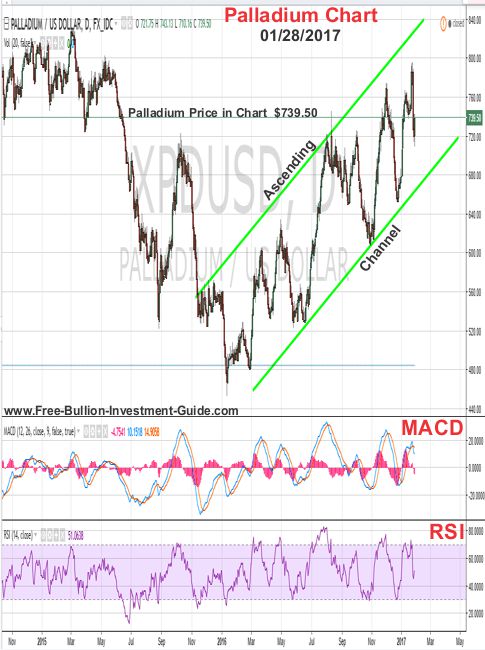
Last week, the Ascending Channel was identified in Palladium's chart, palladium has been trading within this channel since November/December 2016.
The price of Palladium fell over $50.00 last week, but the fall in price didn't give any indication as to which direction it will move this week.
There are no clear patterns in the chart, except that the MACD and RSI are trading in oversold territory, so more consolidation or profit taking is expected this week.
This week I didn't get a chance to listen to music much as I created this post because I've been having kind of a hectic weekend; So until next week...
I Hope You Have a Great Week.
Thank you for your time & God Bless,
Steve
Thank You for Visiting the Free Bullion Investment Guide
This Guide gives 50% or more of what it earns to those who are Battling Cancer.
Please Help Us Give by Supporting our Affiliates.
(Every Advertisement on the Guide is from one of our Affiliates)
'Click Here' see all of the prior Blog posts,
Thank You for Your Time!
|
Support this Guide & Paypal Thank You for Your Support |
|
|
 | |||||
This website is best viewed on a desktop computer.
Keep this Guide Online
& Paypal
Thank You for
Your Support
with Feedly
Search the Guide
| search engine by freefind | advanced |
Premium Canadian Bullion
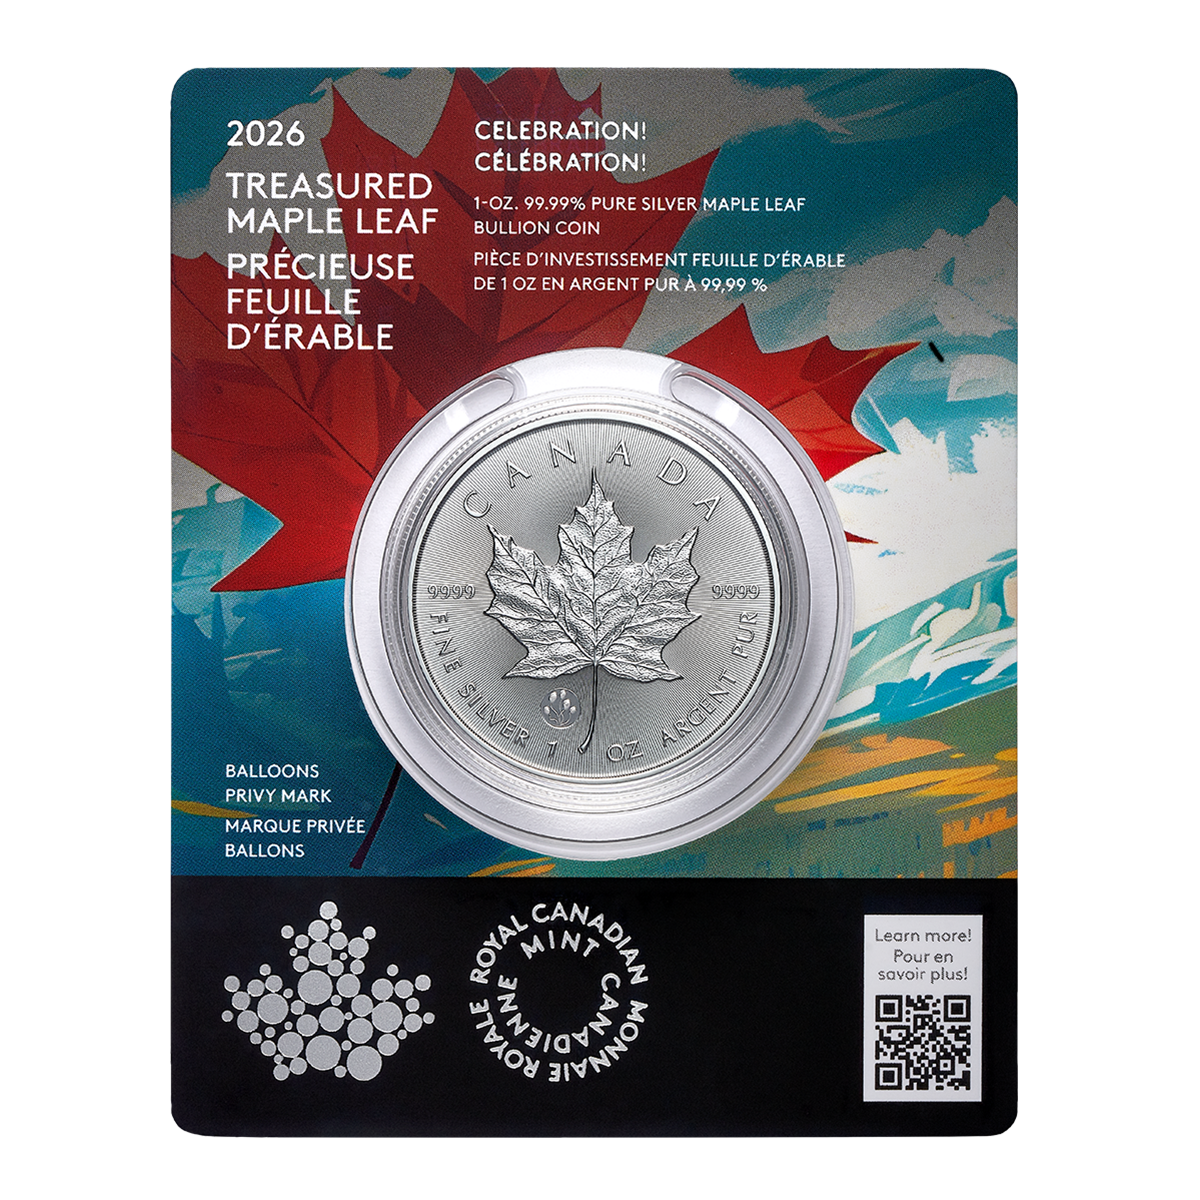
Give a lasting gift of the iconic Silver Maple Leaf bullion coin [More]
Free Shipping on Orders over $100 (CDN/USA)
or
From the U.K. Royal Mint
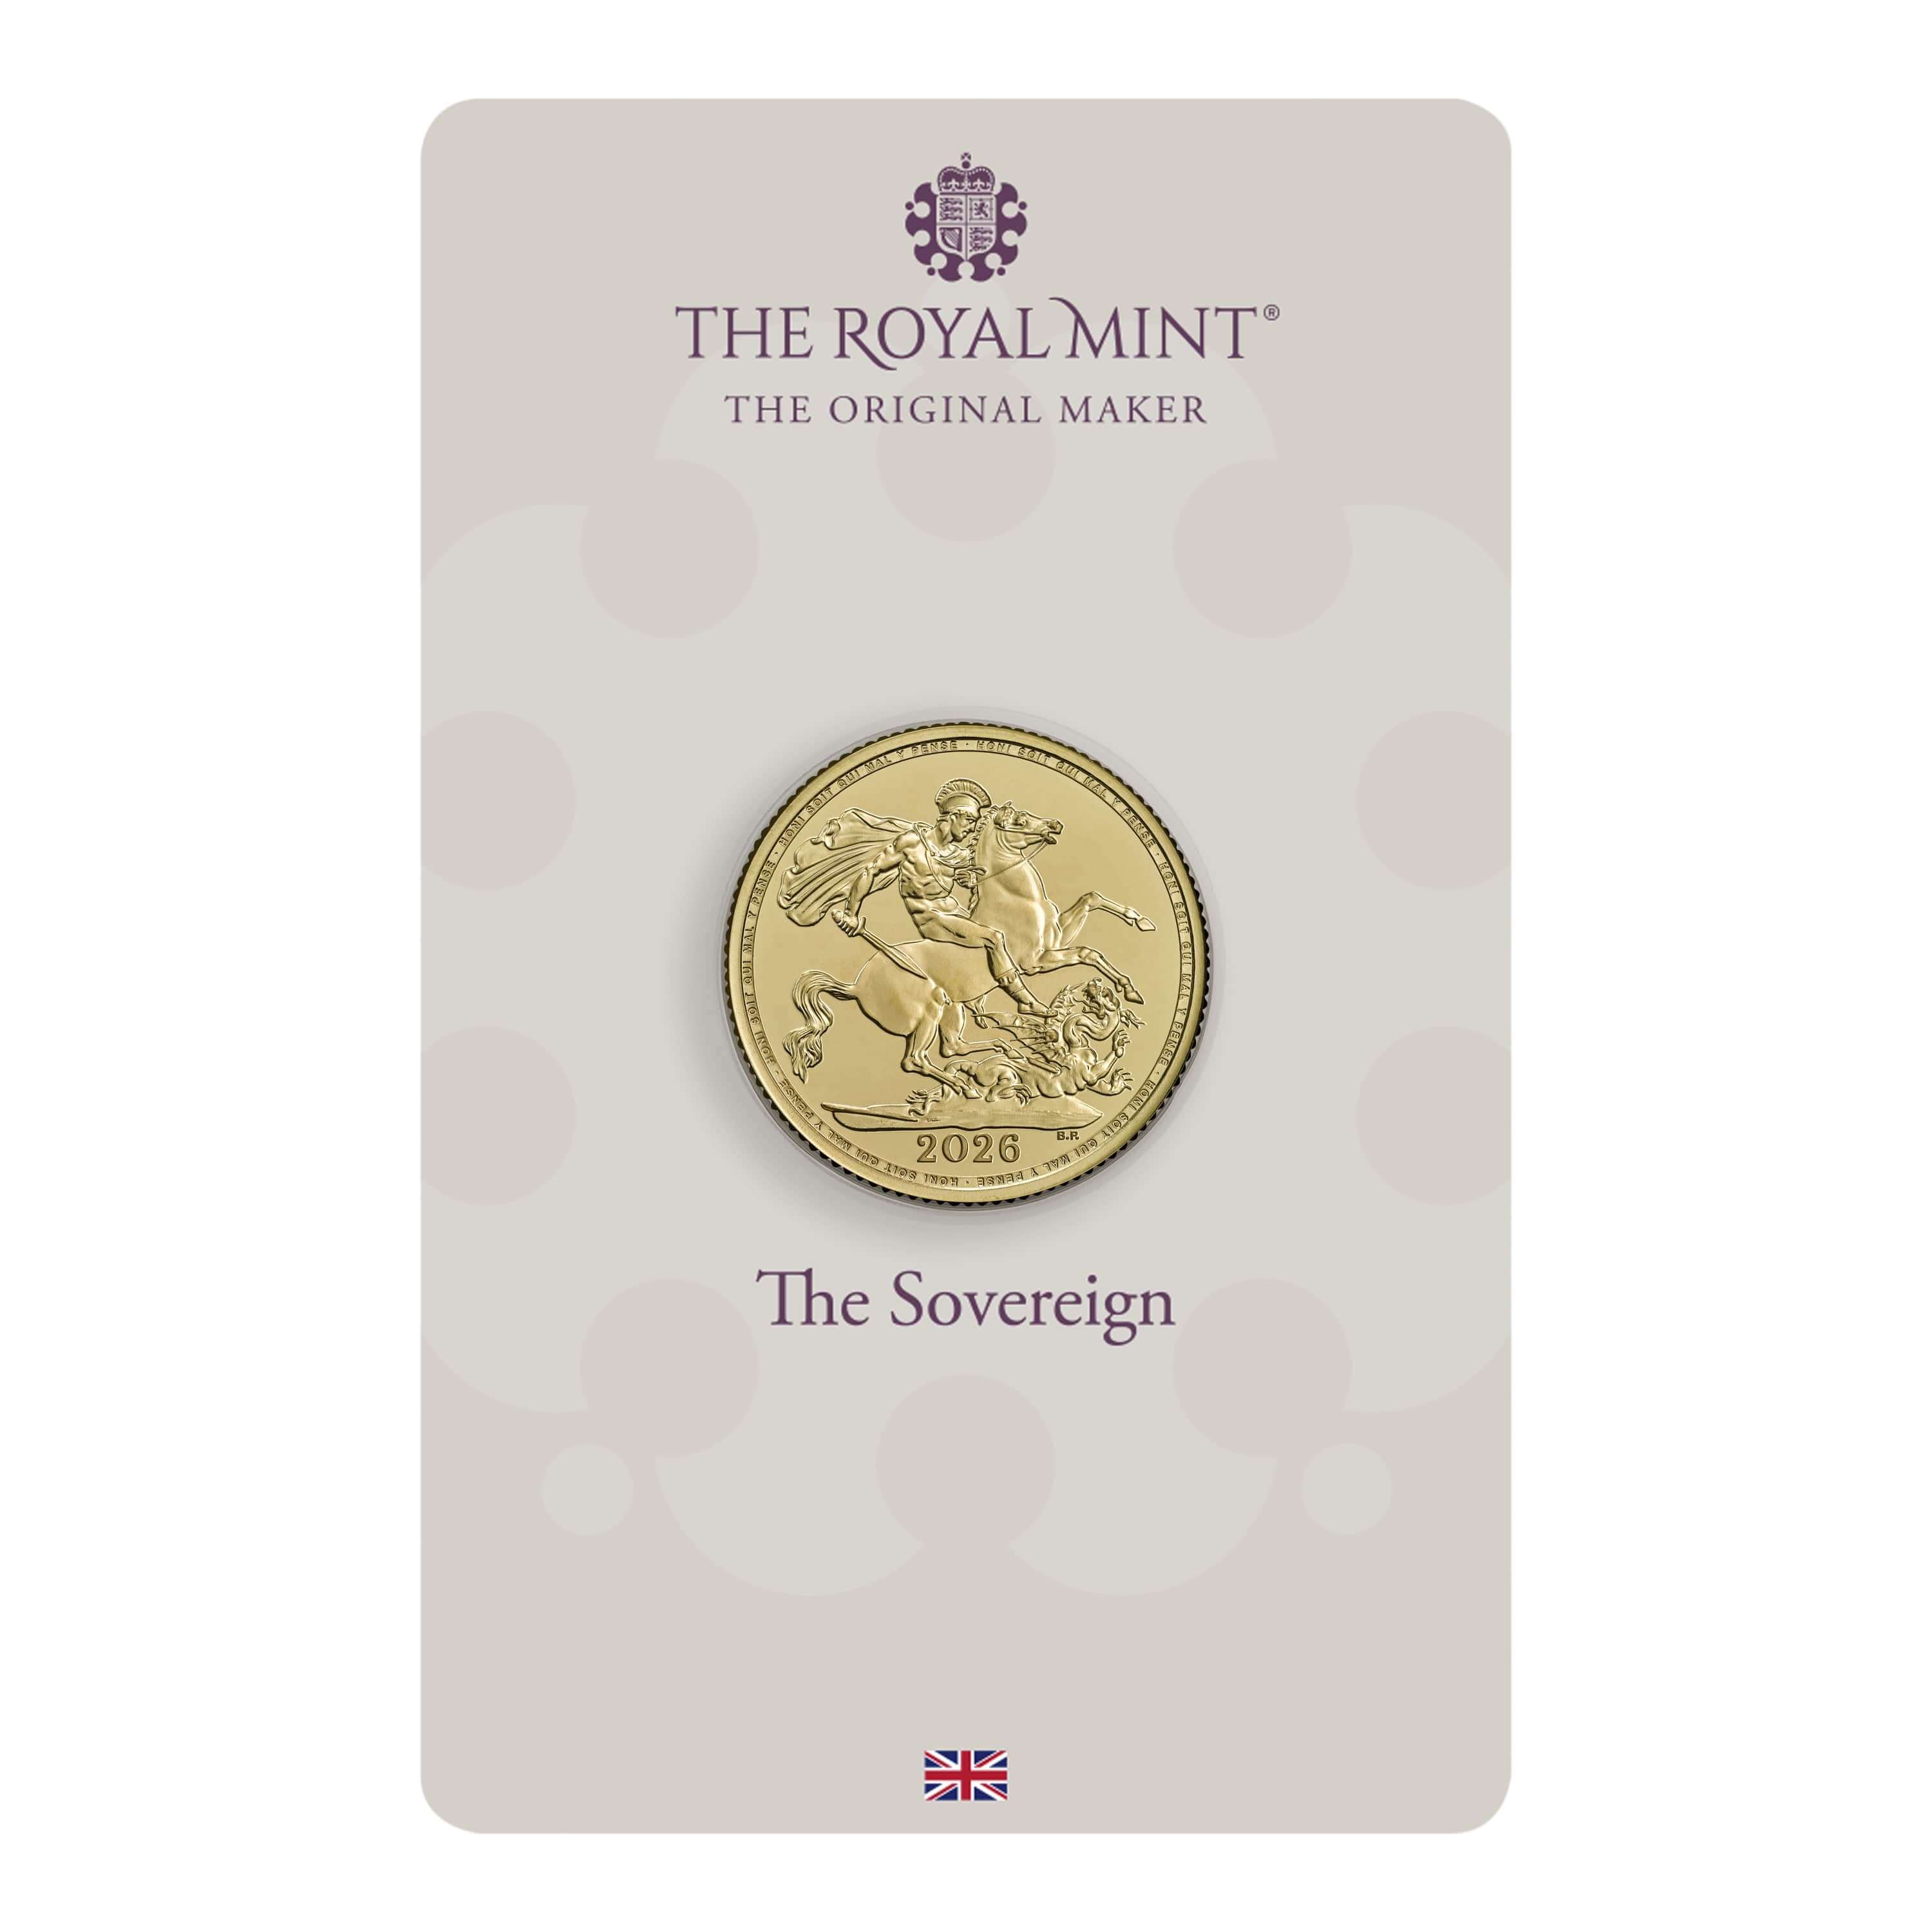

Daily
Newsletter
Updated Mintages for
American Gold Buffalo
American Gold Eagle
American Silver Eagle
2024 & 2025
Jerusalem of Gold Bullion
Coin photos
(bottom of page)
Mintages
for
2024
Gold & Silver Mexican Libertad
|
Gold Libertads |
Chinese Gold Coin Group Co.
& Chinese Bullion
Help Us Expand our Audience by forwarding our link
www.free-bullion-investment-guide.com.
Thank You!
Last Month's

In No Particular Order
January 2026
All Articles were Originally Posted on the Homepage

