Gold's
Walking a Tightrope
Review and Outlook for the U.S. Dollar, Silver, and Gold
Originally Posted on 7/16/2018 @ 12:45 pm EDT
by Steven Warrenfeltz
Subscribe to this Blog
Hello,
Thank you for visiting the Free-Bullion-Investment-Guide, every visit you make is greatly appreciated.
Before we get to this Review & Outlook, below are some of the Best Bullion Market-Related News articles that were taken from this guide's home page, over the last few weeks.

AUDIO: Greg Weldon on Seeking Shelter From the Storm - Financial Sense
Gold, Silver Plunge in First Half of 2018; US Mint Bullion Sales Drop - Coin News
Gold Volatility is Near a Historical Low, Is it Time to Buy? - Market Slant
Buying gold and dumping stocks is a no-brainer this summer - The National
Gold industry considers its carbon footprint for concerned investors - Coin World
Despite decreased bullion sales in June, bullion coins may be the way of the future for U.S. coinage - Mint News Blog
Best of the Week for
Gold NanoParticle Cancer Research
Gold Nanoparticle Cancer Research Report #9 - Free Bullion Investment Guide
Gold is trading above a thin line that represents whether or not it is in a positive market, as long as it stays above the line, things look good, but if gold breaks it, it could ultimately be as bad as falling off a tightrope for the precious metal.
Silver's already fallen below its tightrope, as you'll see in the charts below, we'll see what gold does in the days and weeks to come, but to stick with the order of things, I'll be getting to gold last, first off in the charts below is the U.S. Dollar, then Silver.
Review & Outlook
|
All the charts on this blog are Daily Charts unless noted otherwise.
US DOLLAR
In Review
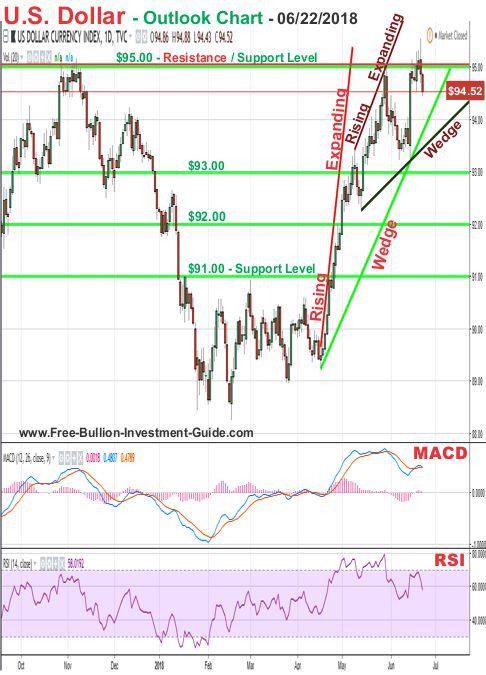
Three weeks ago, the outlook below was posted for the U.S. Dollar.
In the outlook chart below, you can see that the U.S. Dollar's price chart now has two negative 'Rising Expanding Wedge' patterns.
The older one is expected to be confirmed before the new one, simply because of where their lower trend-lines fall.
This week we may see the dollar finally fall below the bottom trend-line of the two-month-old 'Rising Expanding Wedge,' confirming it, simply because it seems the 'Trade War' is heating up.
The tariffs in the Trade War aren't supposed to take effect until July, so because the market is often seen as 'forward-looking,' we may see the expected effects of a 'Trade War' start move the dollar lower.
So for the week to come, we may see the dollar finally break below the older 'Rising Expanding Wedge' and possibly the new one too.
The U.S. Dollar's movement, this week, is mostly up to how the fundamentals in the market shape up.
If there is some kind of positive break-thru that keeps the 'Trade War' with China, Europe, and other countries from happening, then we may see the dollar abruptly stop its fall and either consolidate before more information is released or it may continue to move higher.
Or
If the 'Trade War' starts as expected, we should see the dollar fall more in price...Time will tell.
U.S. Dollar - In Review - continued
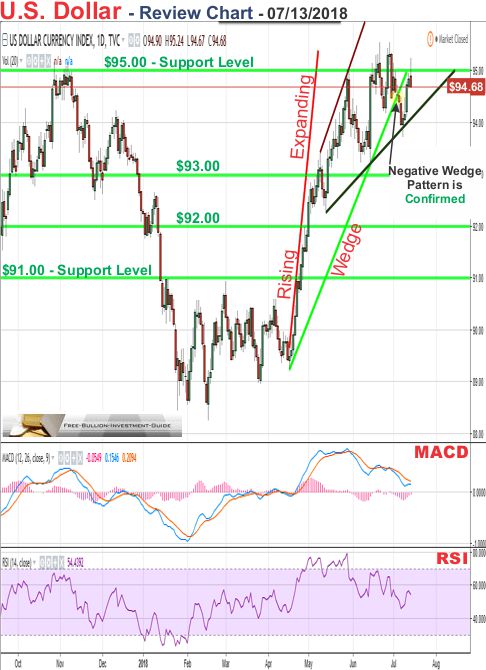
The U.S. Dollar has moved a lot since the outlook chart above was posted, three weeks ago.
However, the dollar did bounce for a short time, but then it finally confirmed the Larger of the two 'Rising Expanding Wedges' in its chart.
In addition, in the dollar's moved down, after breaking the larger wedge, it stopped falling at the bottom trend-line of the smaller 'Rising Expanding Wedge.'
The move down may have had something to do with the Trade War, but it seems that it had more to do with profit taking than anything else.
The 'Trade War' is just beginning, so its a bit premature to think it will have a big effect on the dollar, which is why it has had little effect on the dollar's price, so far.
U.S. Dollar - Outlook
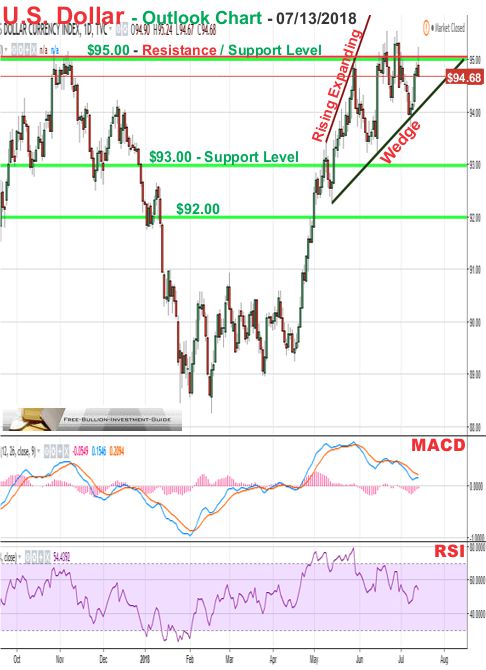
In the outlook chart below, the U.S. Dollar looks to be having a hard time staying above the $95.00 resistance/support level.
The dollar's move up has been greatly helped by the Federal Reserve hawkish stance and rate hikes along with the help of the roaring economy and jobs numbers.
However, inflation is slowly ticking higher and higher and sooner or later it will start to eat away at the dollar's strength.
For the dollar's outlook, the $95.00 price level looks to be it's biggest hurdle, if it doesn't break it, we will see the negative 'Rising Expanding Wedge' pattern confirmed in the next week or two.
Charts provided courtesy of TradingView.com
U.S. Dollar's Price Resistance and Support Levels
U.S. Dollar's Resistance Levels
$96.00
$95.00
U.S. Dollar's Support Levels
$93.00
$92.00
$91.00
SILVER
In Review
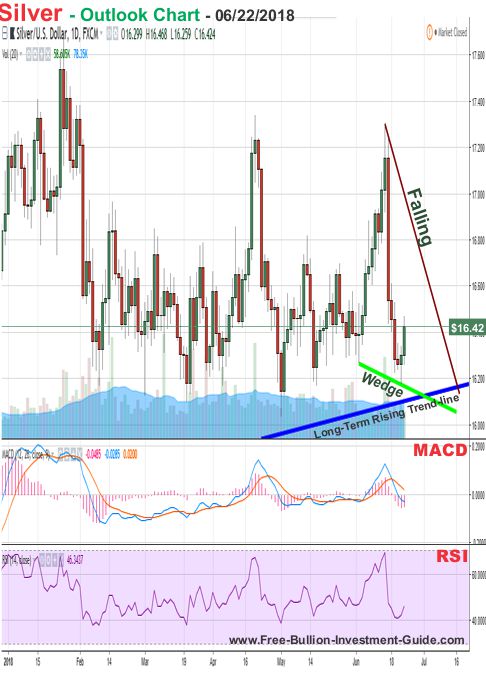
Three weeks ago, the following outlook was posted for Silver.
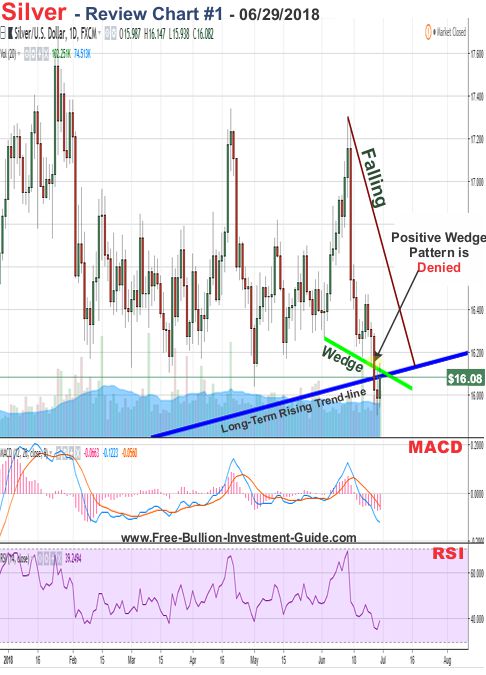
In silver's outlook chart below, you can see that it has formed a 'Falling Wedge' pattern.
Even though this wedge is considered to be a positive pattern, because of its proximity to the 'Long-Term Rising Trend-line' its positive effects could be brief.
If the price of silver falls below that rising trend-line, which currently sits around the $16.25 level, we could easily see silver fall below the $16.00 level and lower.
Silver's riding a double edge sword if a full-blown Trade War occurs it could hurt silver's industrial market, which could send its price lower.
However, silver could see a rise, this week, if traders run to it for its safe haven/inflation hedge side of the market.
For silver's outlook, the 'Falling Wedge' is broad enough that the price has room to move inside it before it either confirms or denies it.
Personally, I'd like to see it rise and get away from its 'Long-Term Rising Trend-line, but I'm only an interpreter and because of all the variables in the market, silver could literally move either way this week.
Silver - In Review - continued
First off, silver's safe-haven properties haven't helped it as of late, nor has the possibility of a 'Trade War,' instead its been the dollar's steady rise that has consistently driven silver lower.
In the first review chart below, you can see that silver broke below the bottom trend-line of the falling wedge, denying the pattern's expected positive movement.
continued to the next review chart, below...
Silver Review Chart #1
Silver - In Review - continued
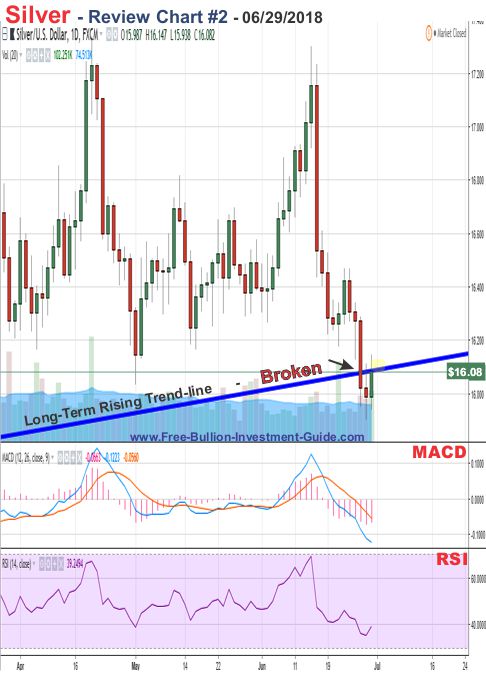
Furthermore, by viewing the chart above or below, you can see that the price of silver also broke it's Long-Term Rising Trend-line (tightrope) two weeks ago.
This is not a good sign for silver; please continue to silver's outlook section below to see how this action has affected silver.
Silver Review Chart #2
Silver - Outlook
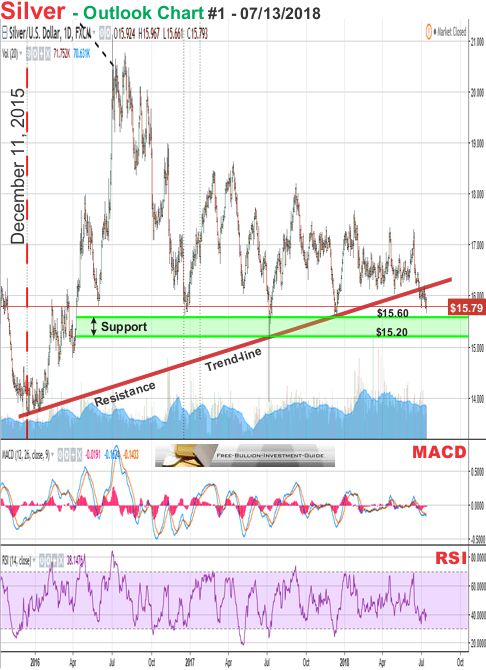
In the first outlook chart below, you can see that silver's Long-Term Rising Trend-line was over 2 years old, and there aren't any more to find.
In all honesty, you could draw a trend-line off the December 2015 low to the fat-finger low made in July of 2016 (seen in the middle of the chart below), but I've tried, the line is practically horizontal and isn't worthy of being called a rising trend-line.
In addition, now that silver broke below this level, the 'Long-Term Rising Trend-line' goes from a strong support level to a strong resistance level, you will see more evidence of this resistance in the second outlook chart, below.
Furthermore, now that we can't draw anymore rising trend-lines, we only find support in horizontal lines, from previous trading levels.
Support for silver now sits in the area between $15.60 to $15.20, as seen in the chart below.
Note: the black dotted line, at the top left of the chart, that isn't labeled, was silver's Long-Term Falling Trendline, which it broke in April of 2015.
Silver Outlook Chart #1
Silver - Outlook - continued
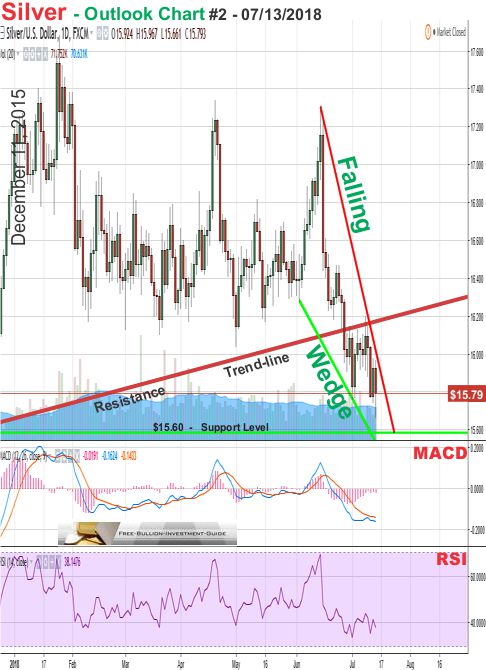
In the chart below, you can see what I was talking about, above, concerning the 'Long-Term Rising Trend-line' turning into a strong resistance level for silver.
Furthermore, since silver broke below the rising trend-line it hasn't been able to break above it, and even though it is now trading inside a positive 'Falling Wedge' pattern, it's doubtful that it will break above its new resistance level.
So silver's outlook is for it to break and confirm the 'Falling Wedge' to the upside, this week or next, but it doesn't seem to have the strength to break its new 'Resistance Trend-line,' in that move up.
Silver Outlook Chart #2
Charts provided courtesy of TradingView.com
Silver's Price Resistance &
Support Levels
Silver's Resistance Levels
$16.30
$16.00
Silver's Support Levels
$15.60
$15.20
GOLD
In Review
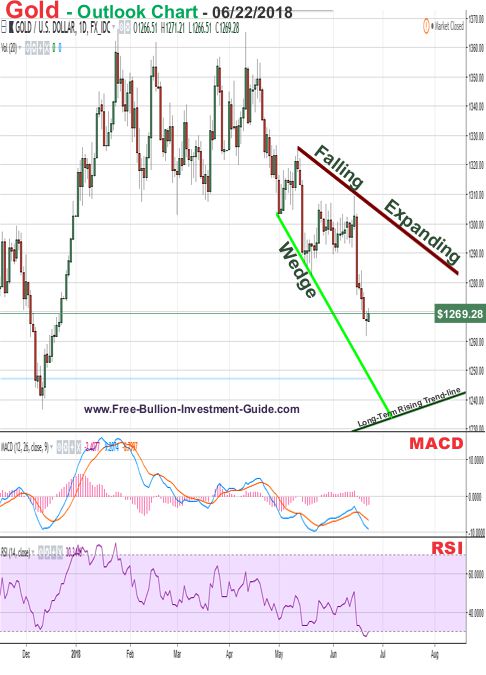
Three weeks ago, the following chart and commentary was posted for gold's outlook.
For most of this year, gold, unlike silver, has been trading well above its Long-Term Rising Trend-line.
But now, as gold has sold-off, it has helped it come down to silver's over-sold levels, and has brought its 'Long-Term Rising Trend-line' back into view.
However, in gold's fall, it has now formed a positive 'Falling Expanding Wedge' pattern.
Like silver, it too has been hit by investor's taking on more risk.
But, that may change this week, as the consequences of a 'Trade War' gets closer, and as a consequence gold may rise as traders seek a safe haven.
In addition, gold's lower indicator's (MACD & RSI) look to be showing that gold's trading deep in oversold territory and could be about to take more of a move up.
Ultimately, time and fundamentals will show us, this week, as to how gold will move.
Gold - In Review - continued
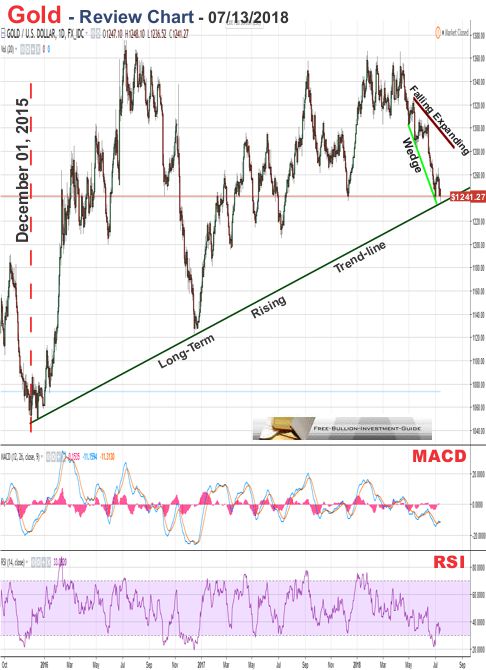
In Gold's review chart below, you can see that the price of gold has continually fallen in price, and its MACD and RSI (lower indicators) have fallen deeper into oversold territory.
Furthermore, even though the Falling Expanding Wedge is a positive pattern for gold, it hasn't helped gold, instead, the fundamental's behind the rising U.S. Dollar has crushed gold.
In addition, in gold's fall, it is now trading along its 'Long-Term Rising Trend-line' or tightrope.
Gold - Outlook
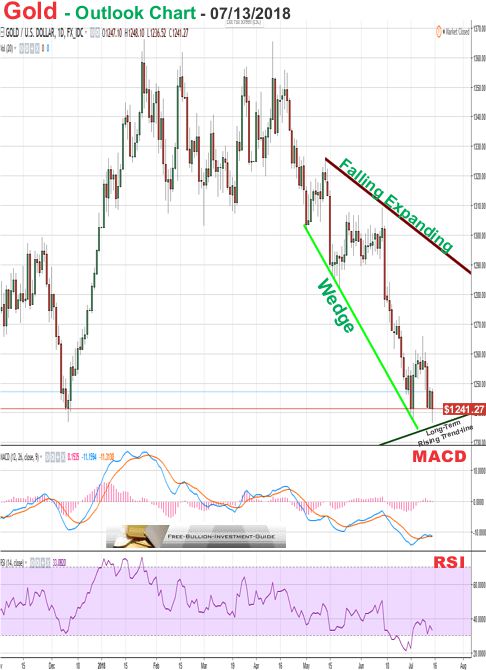
In gold's outlook chart below, you can see that it is practically trading along the rising trend-line and will undoubtedly be 'walking it' in the near future.
The fact that gold is trading inside a huge positive Falling Expanding Wedge pattern won't keep it from falling below the trend-line, the only thing that can keep it from falling under the rising trend-line is trader sentiment, and right now it's not good for gold.
For the week to come, I'm expecting gold to walk the tightrope, it may stay above it or it may not.
In addition, if the price of gold falls below the 'Long-Term Rising Trend-line' then we'll most likely see the price of gold move lower, and the positive wedge may become irrelevant. Time will tell
Charts provided courtesy of TradingView.com
Gold's Price Resistance and
Support Levels
Gold's Resistance Levels
$1300.00
$1280.00
Gold's Support Levels
$1235.00
$1215.00
Thank You for Your Time.
Have a Great Week and God Bless,
Steve
'Click Here' see all of the prior Blog posts,
Thank You for Your Time!
|
Investment/Information Disclaimer: All content provided by the Free-Bullion-Investment-Guide.com is for informational purposes only. The comments on this blog should not be construed in any manner whatsoever as recommendations to buy or sell any asset(s) or any other financial instrument at any time. The Free-Bullion-Investment-Guide.com is not liable for any losses, injuries, or damages from the display or use of this information. These terms and conditions of use are subject to change at anytime and without notice. |
Return from this Guide's Latest Blog Post
|
Support this Guide & Paypal Thank You for Your Support |
|
|
 | |||||
This website is best viewed on a desktop computer.
Keep this Guide Online
& Paypal
Thank You for
Your Support
with Feedly
Search the Guide
| search engine by freefind | advanced |
Premium Canadian Bullion
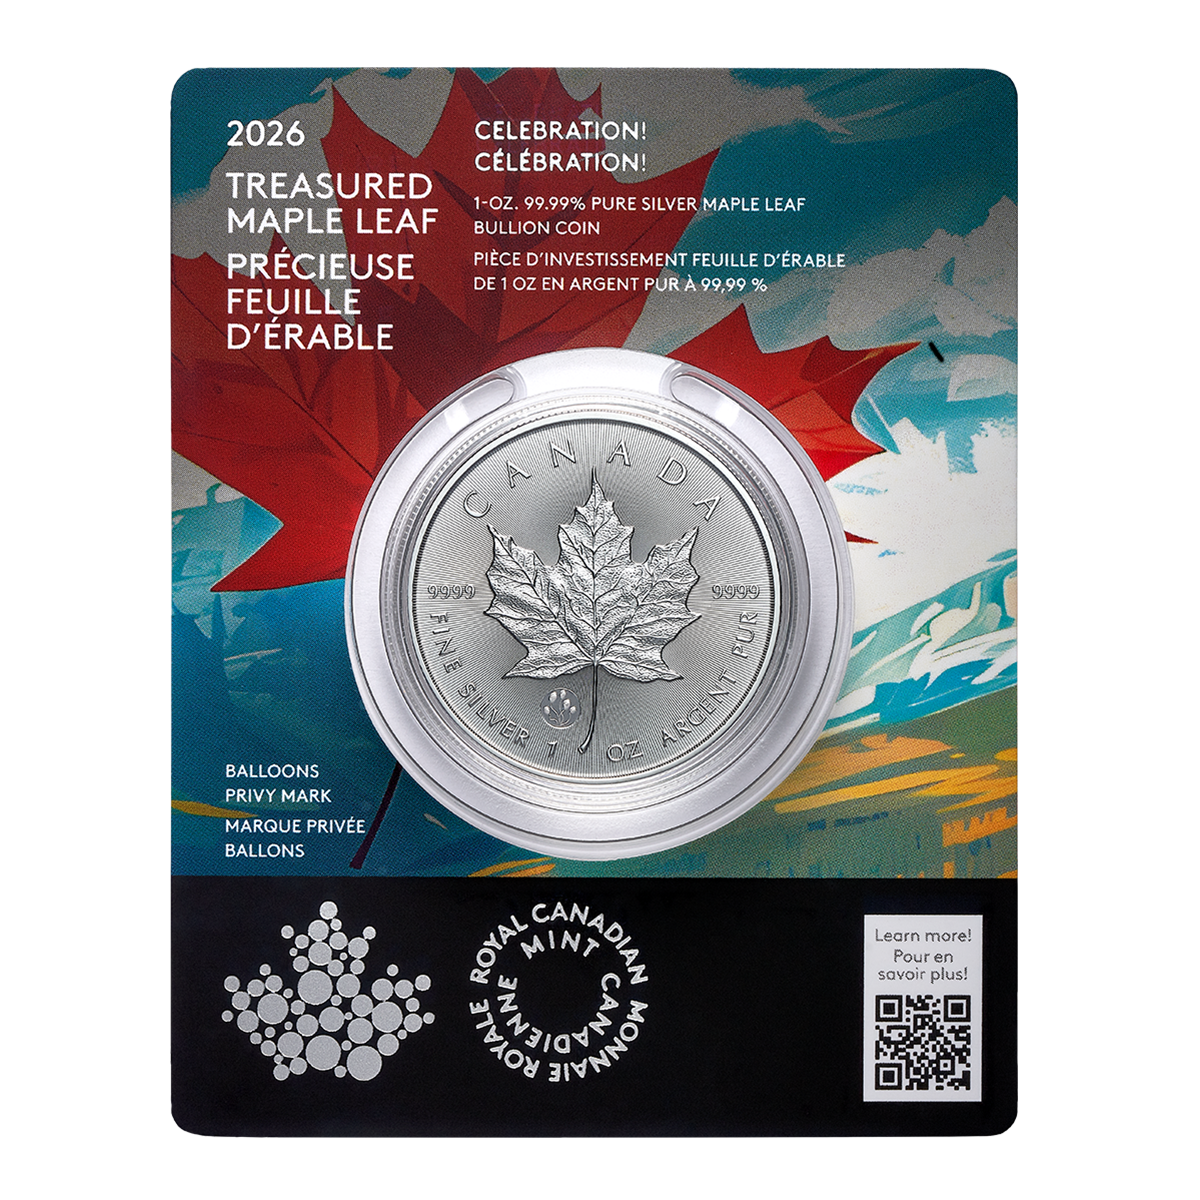
Give a lasting gift of the iconic Silver Maple Leaf bullion coin [More]
Free Shipping on Orders over $100 (CDN/USA)
or
From the U.K. Royal Mint


Daily
Newsletter
Updated Mintages for
American Gold Buffalo
American Gold Eagle
American Silver Eagle
2024 & 2025
Jerusalem of Gold Bullion
Coin photos
(bottom of page)
Mintages
for
2024
Gold & Silver Mexican Libertad
|
Gold Libertads |
Chinese Gold Coin Group Co.
& Chinese Bullion
Help Us Expand our Audience by forwarding our link
www.free-bullion-investment-guide.com.
Thank You!
Last Month's

In No Particular Order
January 2026
All Articles were Originally Posted on the Homepage
