ExpressGoldCash - 4.9 star - Customer Reviews
Silver and Gold Find Support
(in their Short-Term Trade)
Gold, Silver, U.S. Dollar, Platinum, and Palladium Review & Outlook
05/08/2017 thru 05/19/2017
Originally Posted on 05/14/2017 @8:03pm
Subscribe to this Blog
Hello,
Thank you for visiting the Free-Bullion-Investment-Guide's latest blog post, I hope that you and your family have had a great week.
Before we get to this week's post; below are a few of Last Week's Best News Articles that were taken from this guide's homepage.

Business Standard - (India) - April gold import at 75 tonnes
- This Akshaya Tritiya day, 35-40 tonne of gold and jewellery is estimated to have been sold
VIDEO : Kitco - Is Gold Just A Dollar Play Right Now? - Rick Rule
FAKE BULLION ALERT : CoinWeek - Counterfeit Detection: 2017 One Kilo Chinese Silver Panda 300 Yuan
DiMartino Booth - Pension Tension, Part 2: Don’t California My Texas!
Econimica - Misconceptions of "Normal"
Honest Value Never Fails - Silver Sale - Now is the time to buy!
Best of the Week for Nano-Particle Cancer Research
GOLD NANOTECHNOLOGY : CANCER RESEARCH : UVa - VIDEO : Gold Nanoparticles in Treatment of Prostate Cancert
NANOTECHNOLOGY : CANCER THERAPY : WCVB5 - (Boston) - Promising treatment offers new hope to eye cancer patients
Silver and Gold Find Support

SILVER
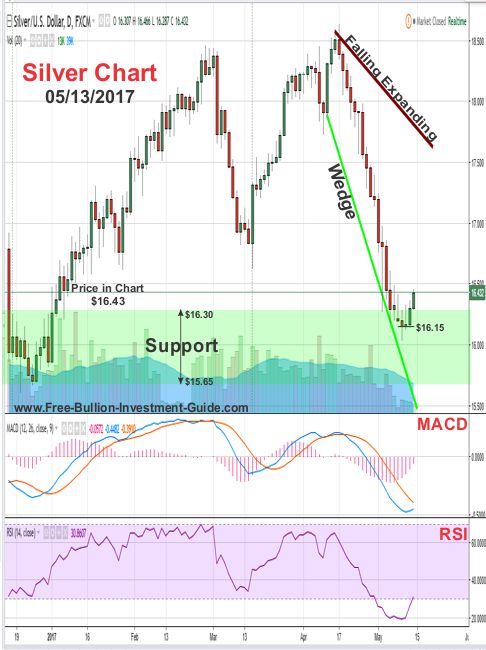
Last week, the silver chart below was posted along with the following analysis.
Now that silver has found support at the $16.30 level, silver's price should start to rebound.
Its RSI is deep into oversold territory and its MACD is slowly starting to change direction.
This week, after all the lines from last week's chart were wiped away, a positive pattern has formed on silver's chart; a bullish falling expanding wedge.
In the week to come, we should see silver reverse its free fall in price and slowly start to move back up in price.
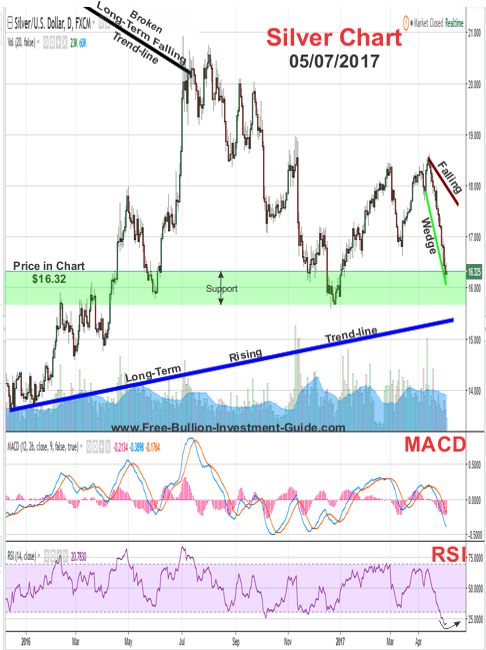
As we can see in the chart below, silver fell a little below the $16.30 and found support at $16.15, then it started to move higher.
Silver is still trading inside the falling expanding wedge and it will continue to trade inside it for at least a few more weeks before its price starts to trade near the wedge's upper trend-line.
For the week to come, silver is trading deep in oversold territory and it is expected to continue to slowly rise in price, with some profit taking along the way.
charts provided courtesy of TradingView.com
Silver's Price Resistance &
Support Levels
Silver's Resistance Levels
$16.80
$16.70
$16.45
Silver's Support Levels
$16.30
$16.15
$15.80
GOLD
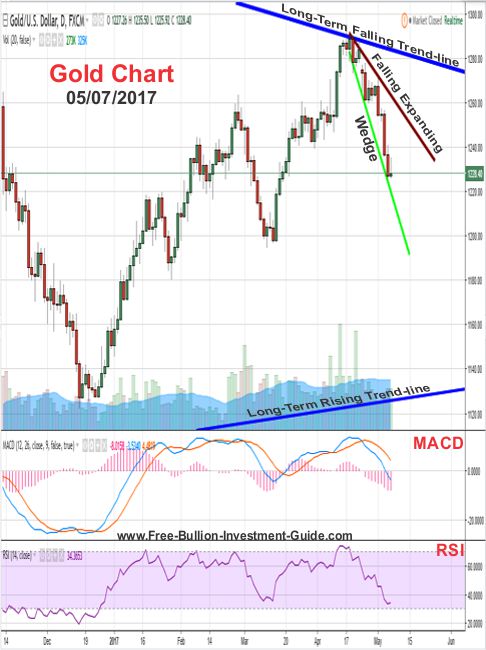
For gold, the chart below was posted with the following analysis:
Like silver, gold’s chart this week is showing a bullish falling expanding wedge pattern.
Even though gold looks like it may fall a little more in price, we should see gold slowly reverse its pattern, like silver, and move higher this week.
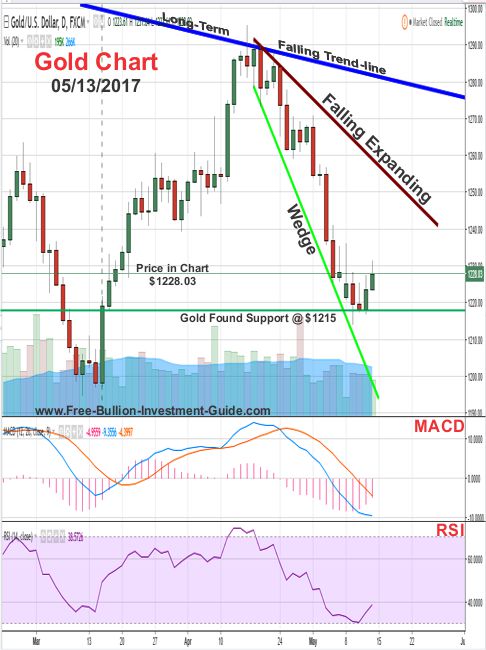
Last week gold found support at the $1215 level, then it slowly reversed its price direction and started to move higher.
This week, gold’s MACD and RSI (bottom indicators), are showing that gold is trading in oversold territory, so for the week to come gold should continue to slowly creep up in price.
Furthermore, like silver, gold is expected to trade inside its falling expanding wedge for at least another week or two before it starts to come close to testing its upper trend-line.
Charts provided courtesy of TradingView.com
Gold's Price Resistance and
Support Levels
Gold's Resistance Levels
$1290.00
$1250.00
$1240.00
Gold's Support Levels
$1215.00
$1200.00
$1180.00
US DOLLAR
Below is last week’s Dollar chart and analysis
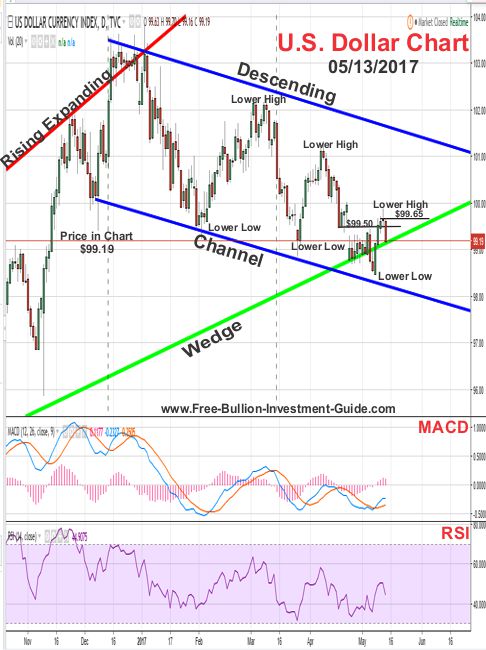
“.… as the dollar broke below the bottom trend-line of the rising expanding wedge, it also fell below the $99.50 support level, turning it into a strong resistance level.
This week, now that the French Presidential Elections are over, and the selling in the dollar is over too (for now), we should see the dollar’s price rise, but it is doubtful it will break back above the $99.50 in the near future.”
(continued....)
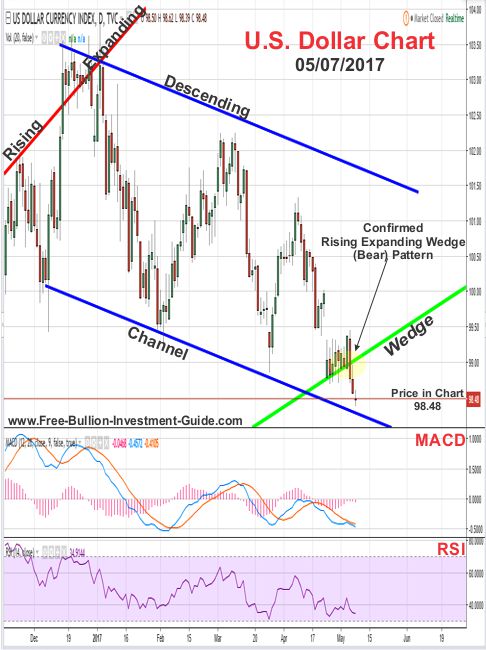
As we can see in the chart below, the $99.50 resistance level wasn’t as strong as I thought it was, because the dollar’s price rose up through it and didn’t stop rising in price till it found resistance at the $99.65 level.
Furthermore, the dollar broke back above the bottom trend-line of the rising expanding wedge and it ended the week sitting on top of this trend-line.
However, the U.S. Dollar continues to make lower highs and lower lows, so it is expected to fall back below the rising expanding wedge sometime in the near future.
Charts provided courtesy of TradingView.com
U.S. Dollar's Price Resistance and Support Levels
U.S. Dollar's Resistance Levels
$100.00
$99.65
$99.50
U.S. Dollar's Support Levels
$99.30
$99.10
$98.60
PLATINUM
Last week. I posted the platinum chart below.
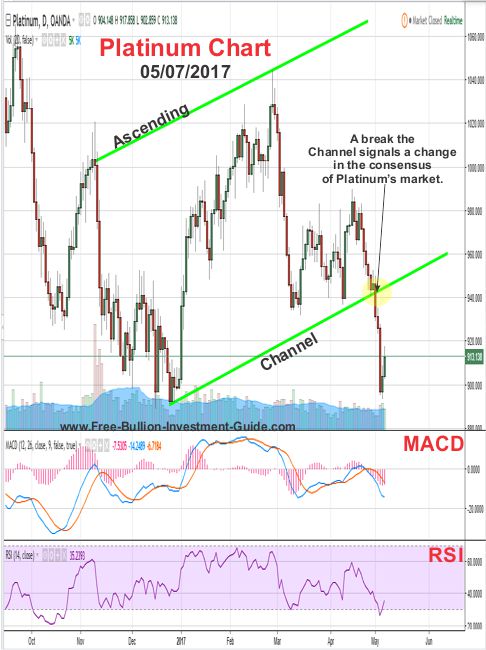
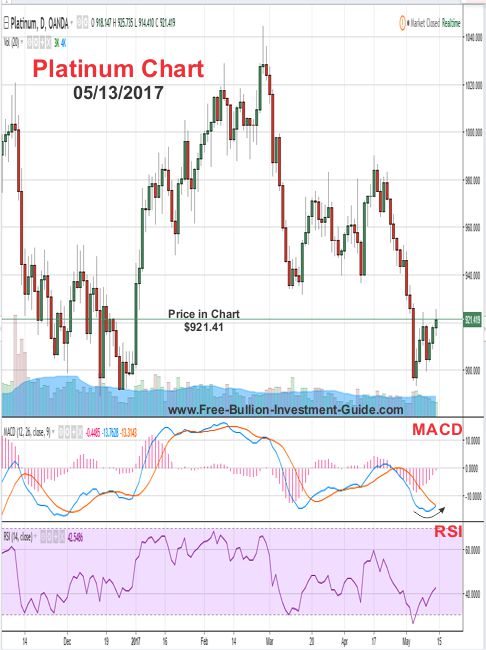
Although platinum rebounded from last week’s drop in price, its chart still isn't showing any clear technical patterns to mention.
However, platinum's MACD (lower indicator) is giving an indication that platinum should continue to rise this week.
Charts provided courtesy of TradingView.com
Platinum's Price Resistance and Support Levels
Platinum's Resistance Levels
$945.00
$930.00
Platinum's Support Levels
$890.00
$855.00
PALLADIUM
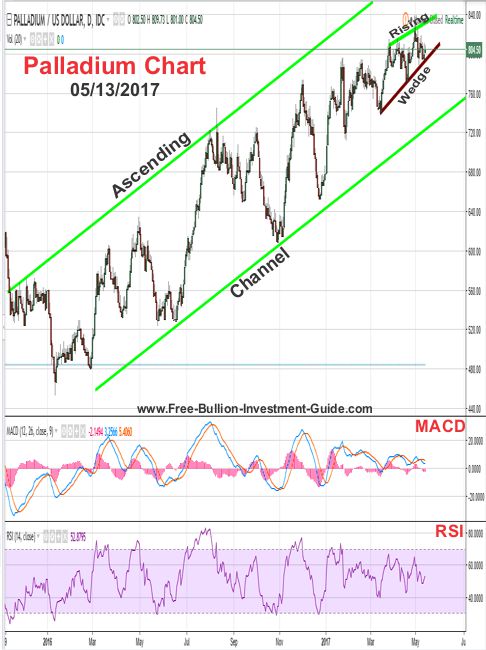
If you’ve been following my analysis for the last few months, you’d know that all the precious metals have been trading inside an Ascending Channel, and all have been broken except for Palladium's Channel.
Palladium has been trading inside its ascending channel since Dec. 2015 and so far it doesn’t look like its going to stop anytime soon.
However, palladium has found itself trading inside a negative pattern called a rising wedge, so although its long-term trade looks positive, its short-term trade doesn’t.
Charts provided courtesy of TradingView.com
Palladium's Price Resistance and Support Levels
Palladium's Resistance Levels
$820.00
$815.00
$810.00
Palladium's Support Levels
$785.00
$770.00
Have a Great Week.
God Bless & Thank You for Your Time,
Steve
'Click Here' see all of the prior Blog posts,
Thank You for Your Time!
|
Support this Guide & Paypal Thank You for Your Support |
|
|
 | |||||
Free Bullion Investment Guide
Keep this Guide Online
& Paypal
Thank You for
Your Support
Search the Guide
| search engine by freefind | advanced |

Daily
Newsletter
2025
Gold & Silver Chinese Panda
|
Silver Panda |
The Perth Mint & Australian Bullion
The Royal Mint &
United Kingdom Bullion Coins
Help Us Expand our Audience by forwarding our link
www.free-bullion-investment-guide.com.
Thank You!
January's

All Articles were Originally Posted on the Homepage


